
-
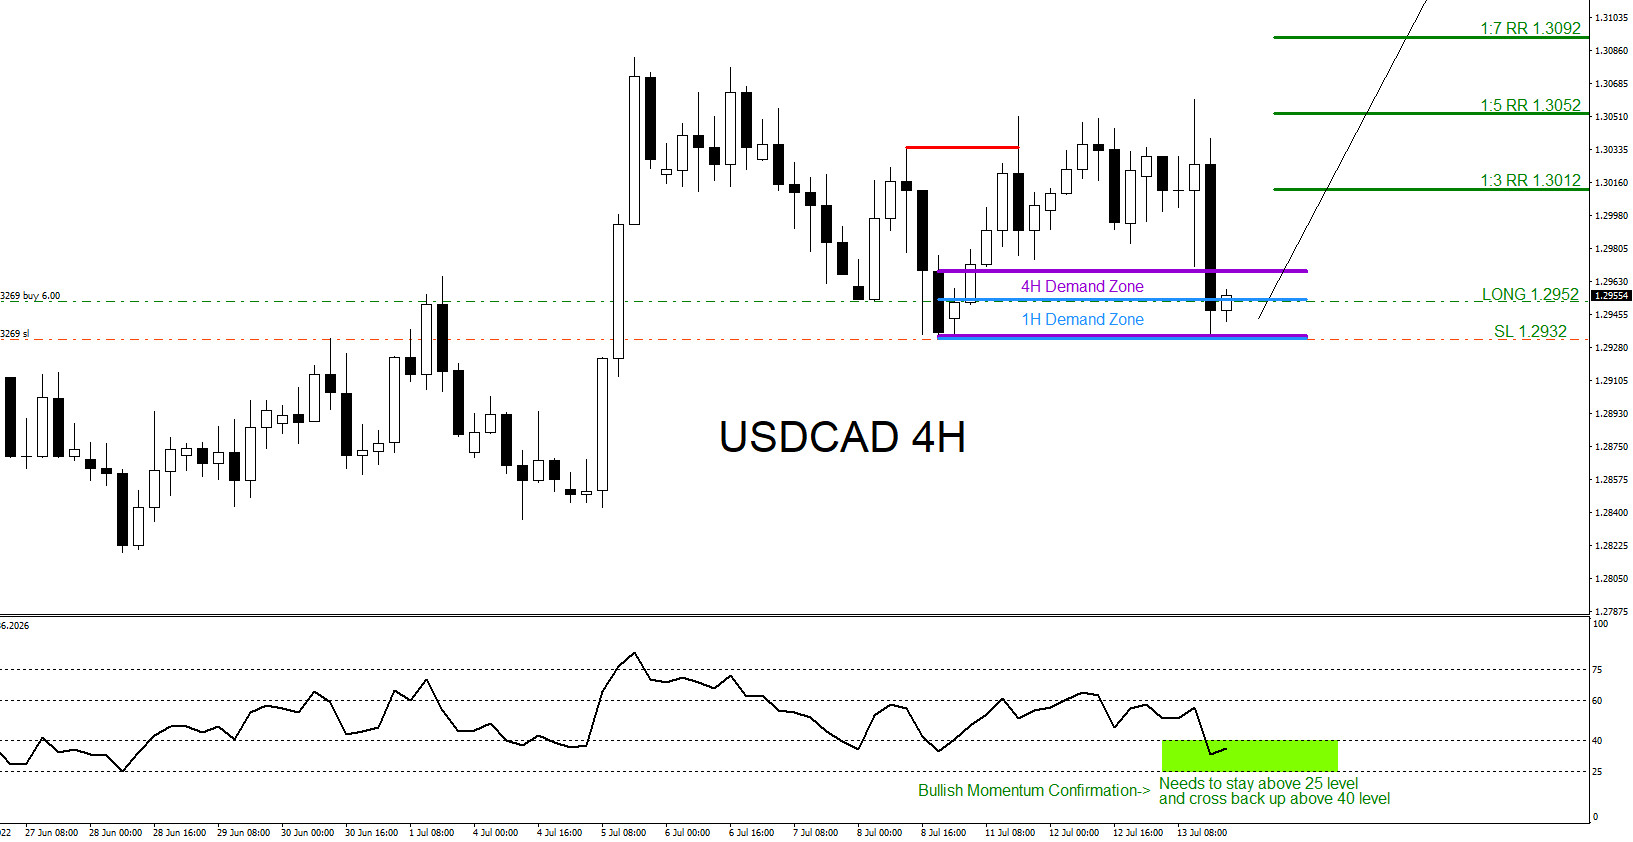
USDCAD : Trading the Rally Higher
Read MoreOn July 11 2022 I posted on social media @AidanFX “ USDCAD : Will be watching the 1.2968 – 1.2934 area for possible buying opportunities.“ The chart below was also posted on July 13 2022 showing the BUY trade setup. Confluence trading is a combination of two or more trading strategies/techniques that come together and […]
-
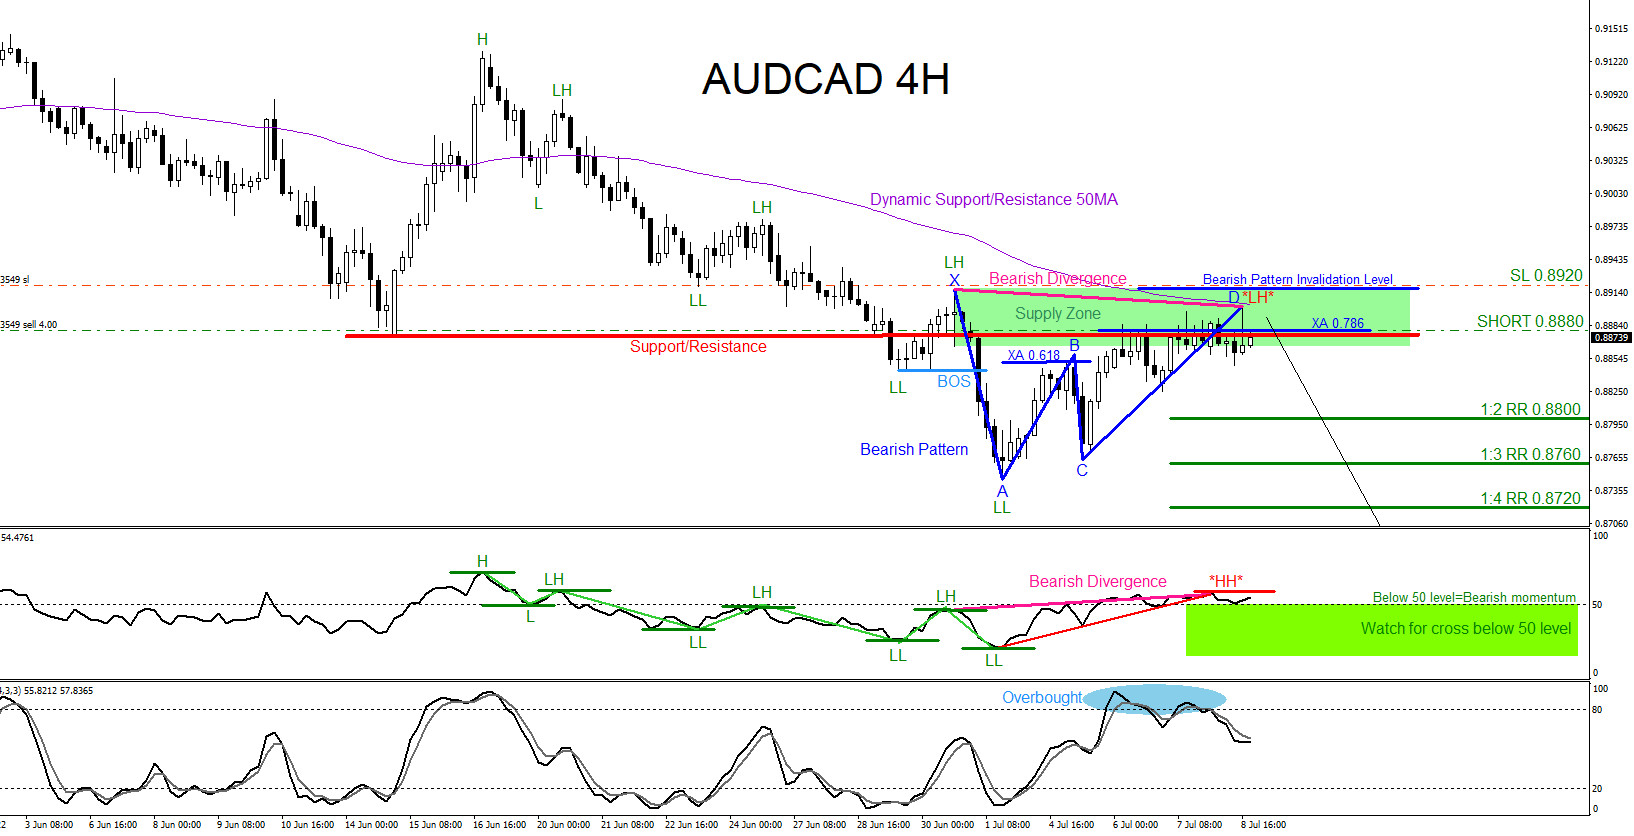
AUDCAD : Catching the Sell Setup for a Move Lower
Read MoreOn July 5 2022 I posted on social media @AidanFX “ AUDCAD : Watch for selling opportunities in the 0.8880 area against 0.8920 stop loss. Pending AUDCAD SELL Limit 0.8880 Stop Loss 0.8920 Target 1 0.8800 (1:2RR) Target 2 0.8760 (1:3RR)“ Confluence trading is a combination of two or more trading strategies/techniques that come together […]
-
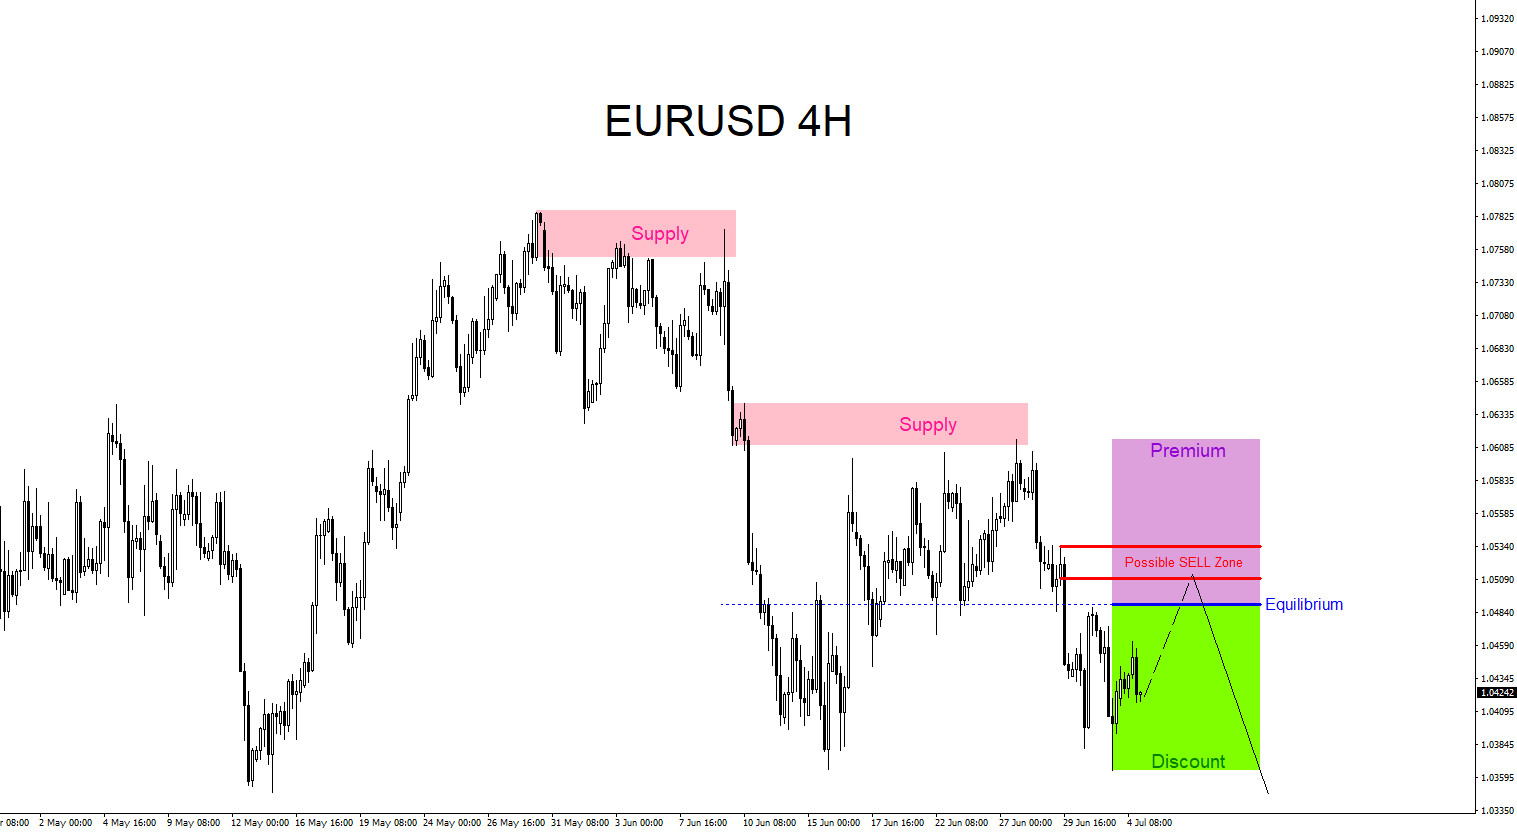
EURUSD : Watch for Selling Opportunities
Read MoreThe chart below of the EURUSD pair is currently trending to the down side making lower lows and lower highs. If looking to trade EURUSD , traders should be patient and wait for price to push higher. Waiting for price to push higher above the equilibrium level (Blue) and into the premium sell zone (Purple) […]
-
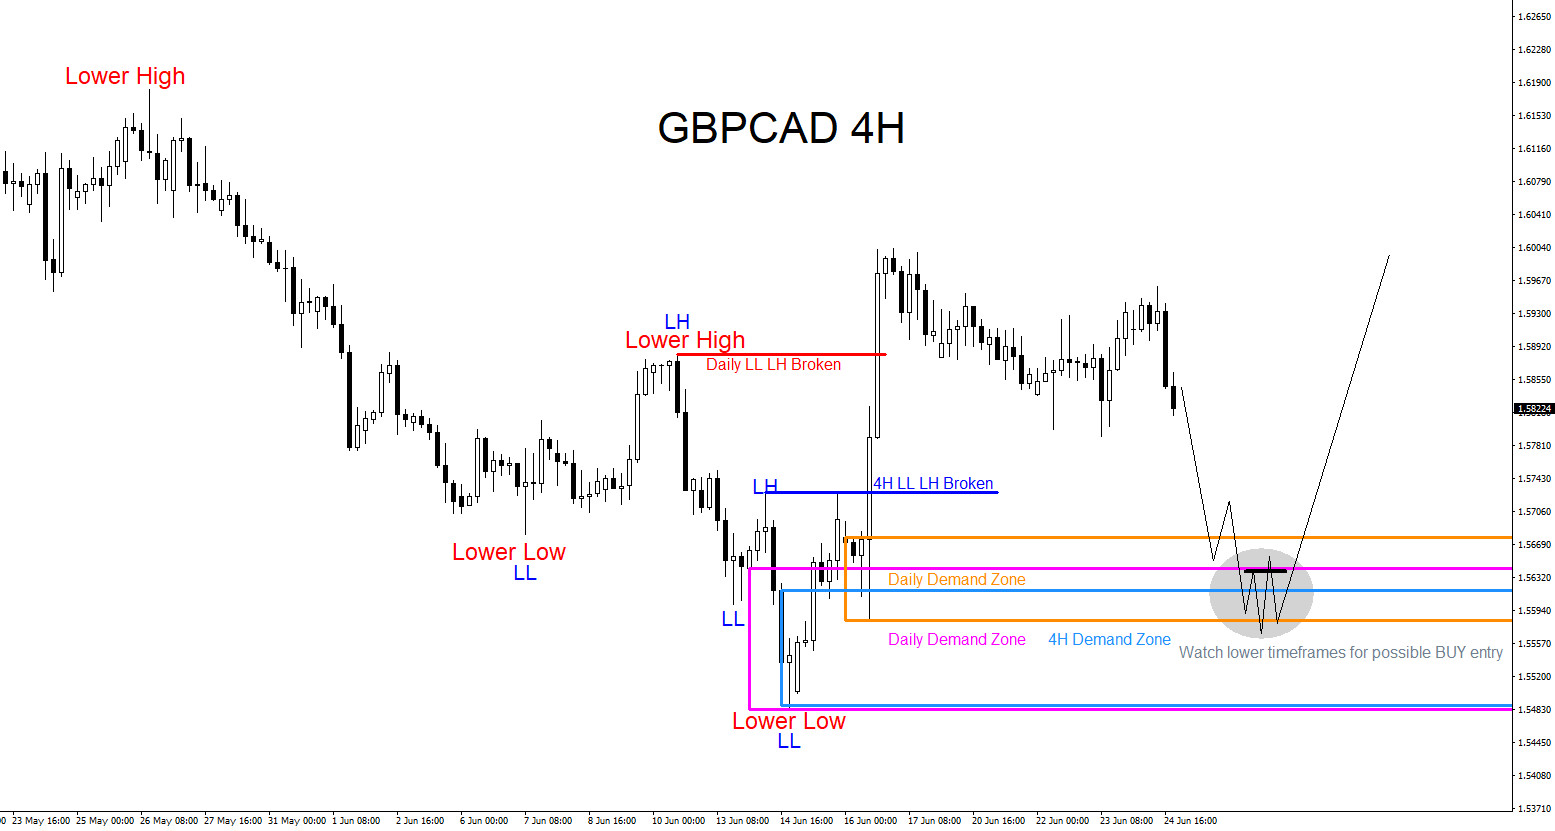
GBPCAD : Will the Pair Continue Higher?
Read MoreIn the daily time frame chart below, GBPCAD has broke the bearish lower low lower high sequence and can be setting up for another round higher. There are possible demand zones/buy zones where buyers can be waiting to push the pair higher. GBPCAD Daily Chart June 26 2022 The 4 hour chart also shows the […]
-
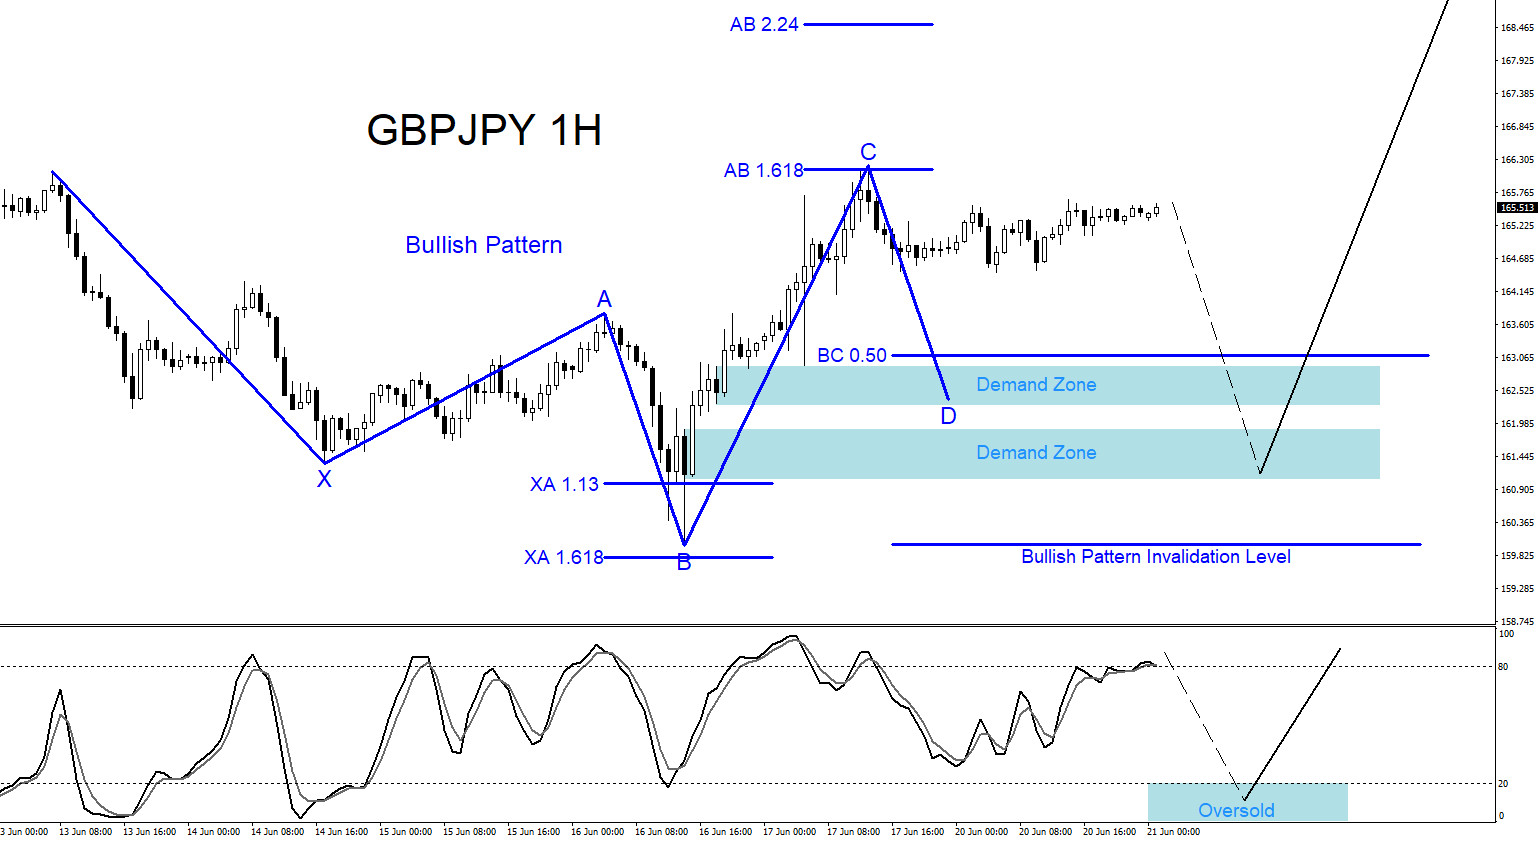
GBPJPY : Possible Bullish Pattern?
Read MoreA bullish pattern is visible on the GBPJPY 1 hour time frame. The blue bullish pattern still needs to make a push lower to complete point D at the BC 0.50% Fib. retracement level where GBPJPY can possibly find buyers to push the pair higher. There are a couple Demand Zones below the BC 0.50% […]
-
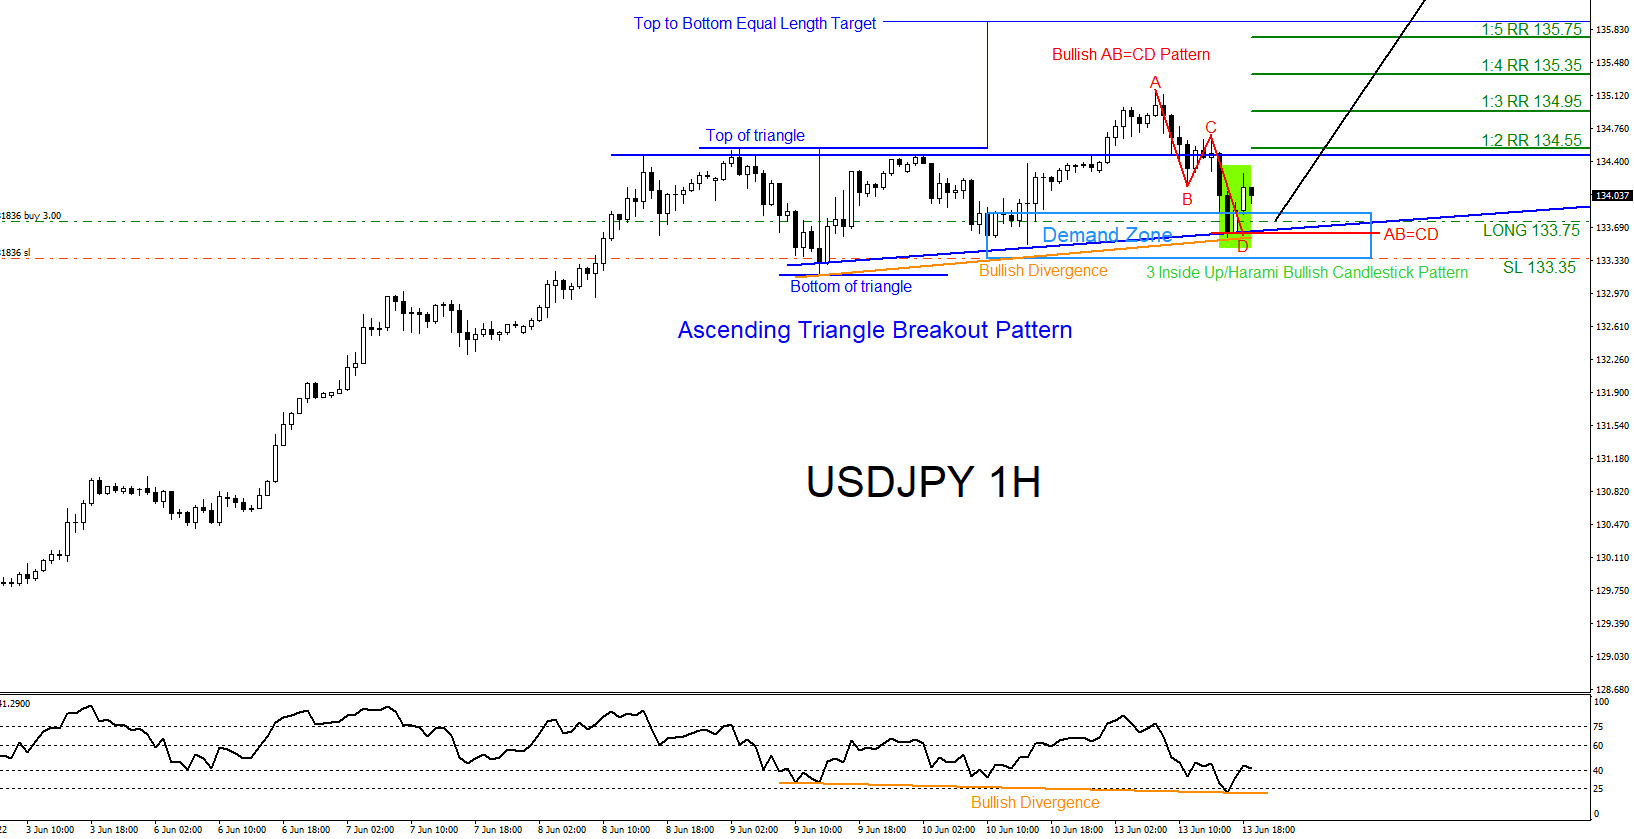
Will USDJPY Continue Higher?
Read MoreThe USDJPY pair has been trending higher since the start of 2021. Most recent low was terminated on May 24 2022 and has bounced higher since. At the current moment there are visible signs that another round higher could be starting. We, at EWF, always recommend our members to trade with the trend and not […]