
-
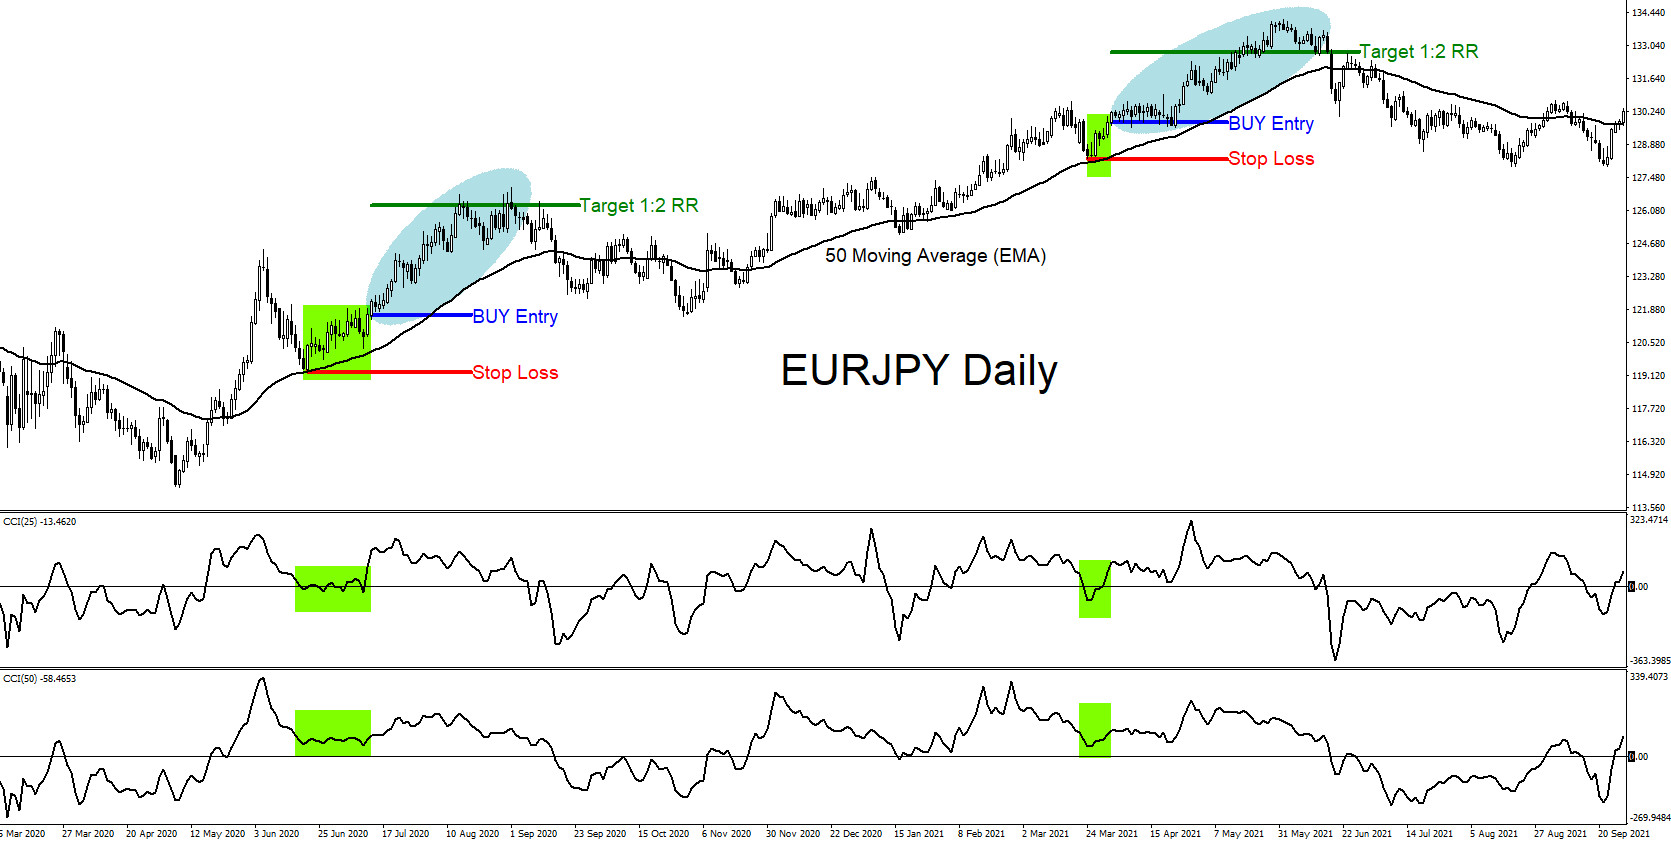
Trend Continuation Trading Strategy
Read MoreConfluence trading is a combination of two or more trading strategies/techniques that come together and form a high probability buy/sell zone in a certain area in the market. Market patterns (Elliott Waves, Harmonic, Head and Shoulders, HH/HL and LL/LH sequences etc.), price action analysis (Support & Resistance, Supply & Demand Zones, Candlestick analysis etc.) and […]
-
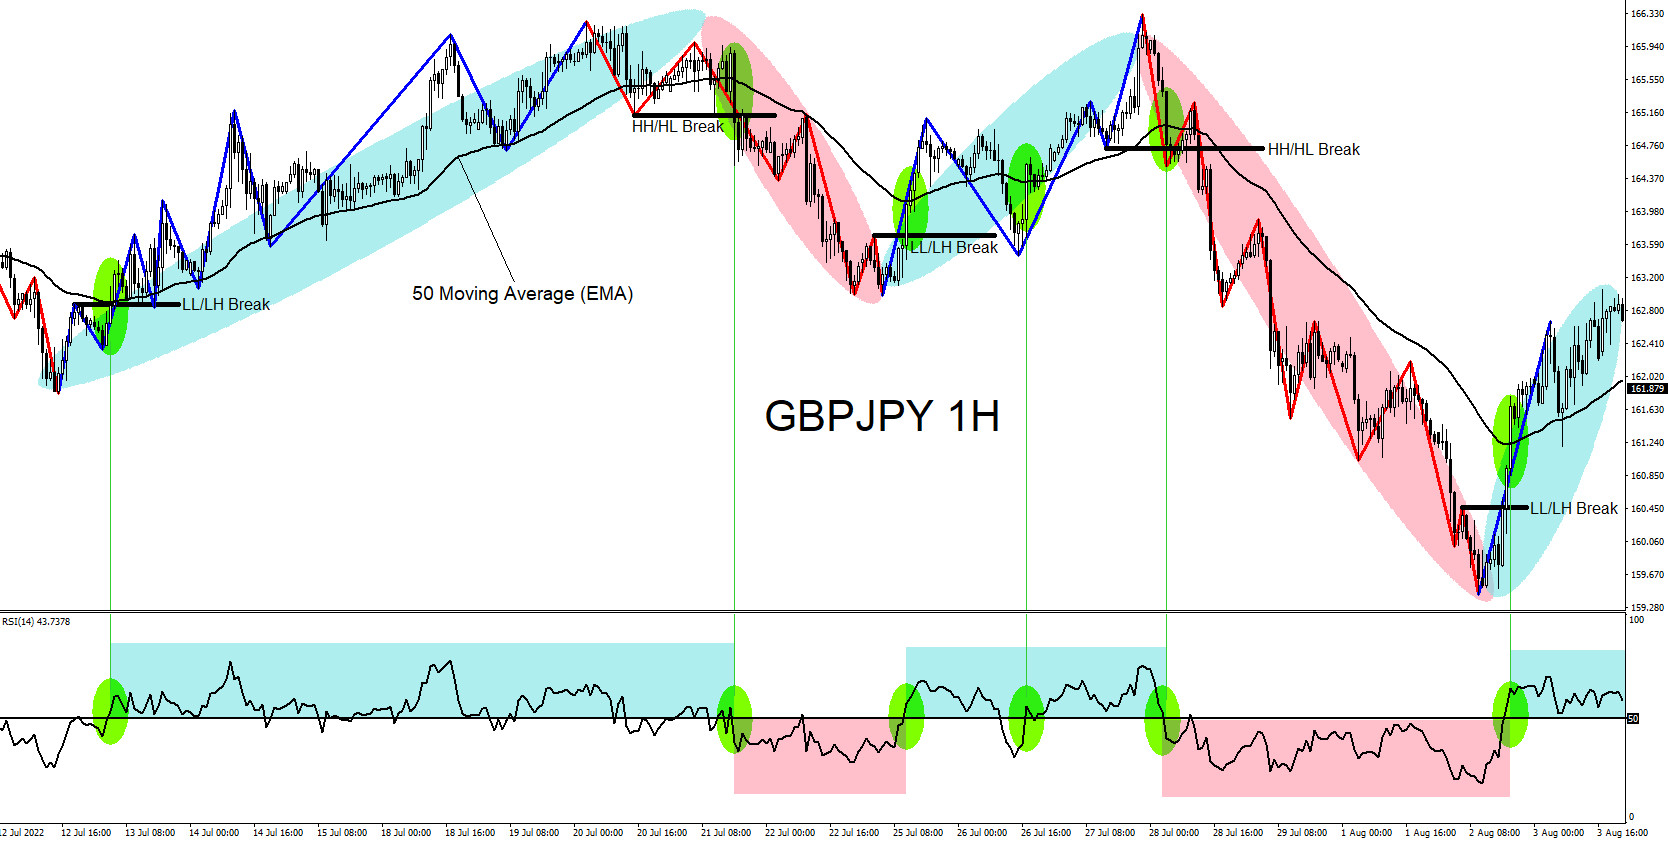
Combining Technical Indicators to Form a Trading Strategy
Read MoreConfluence trading is a combination of two or more trading strategies/techniques that come together and form a high probability buy/sell zone in a certain area in the market. Market patterns (Elliott Waves, Harmonic, Head and Shoulders, HH/HL and LL/LH sequences etc.), price action analysis (Support & Resistance, Supply & Demand Zones, Candlestick analysis etc.) and […]
-
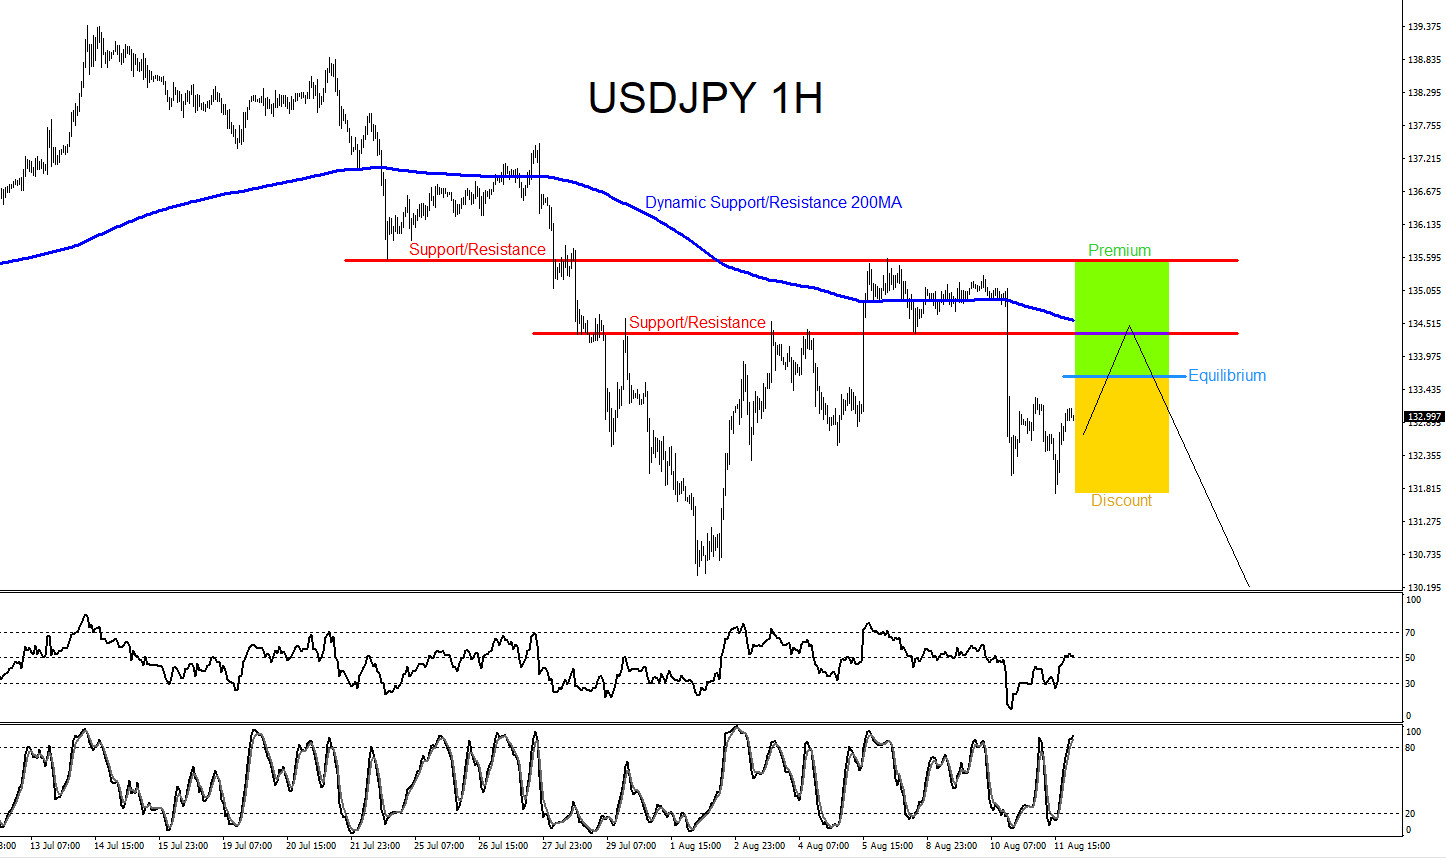
USDJPY : Watch for Selling Opportunities
Read MoreThe chart below of the USDJPY pair is currently trending to the down side making lower lows and lower highs. If looking to trade USDJPY , traders should be patient and wait for price to push higher first, before looking to enter SELLS. Waiting for price to push higher above the equilibrium level (Light Blue […]
-
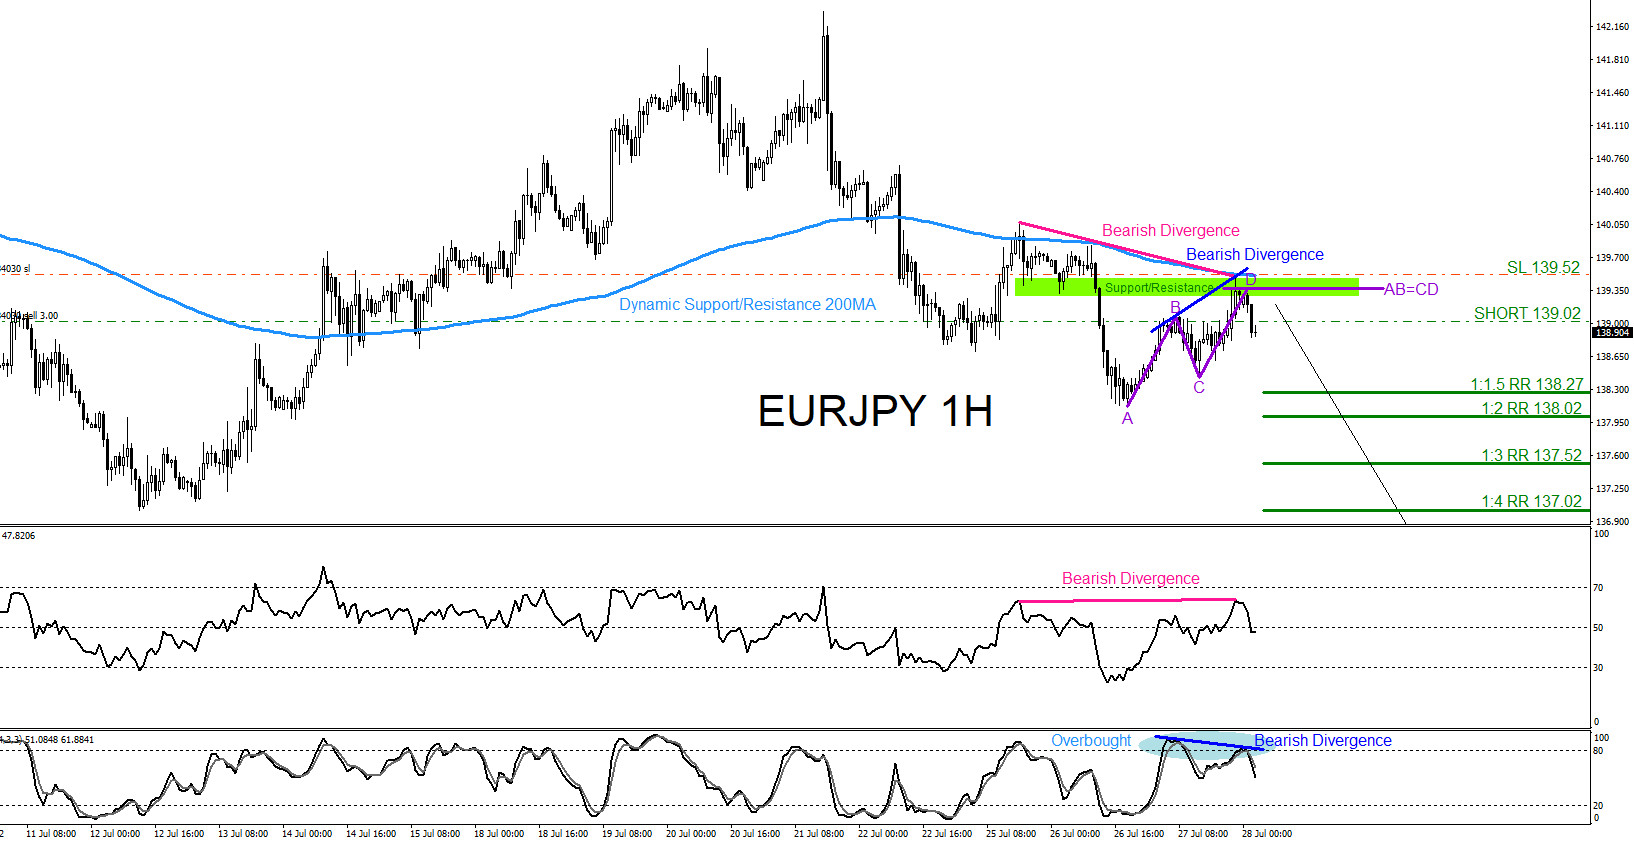
EURJPY : Moves Lower as Expected
Read MoreOn July 27 2022 I posted on social media @AidanFX “ EURJPY is a SELL against 139.52 stop loss. SOLD EURJPY at 139.02 Stop Loss 139.52 Target 138.02“ Confluence trading is a combination of two or more trading strategies/techniques that come together and form a high probability buy/sell zone in a certain area in the […]
-
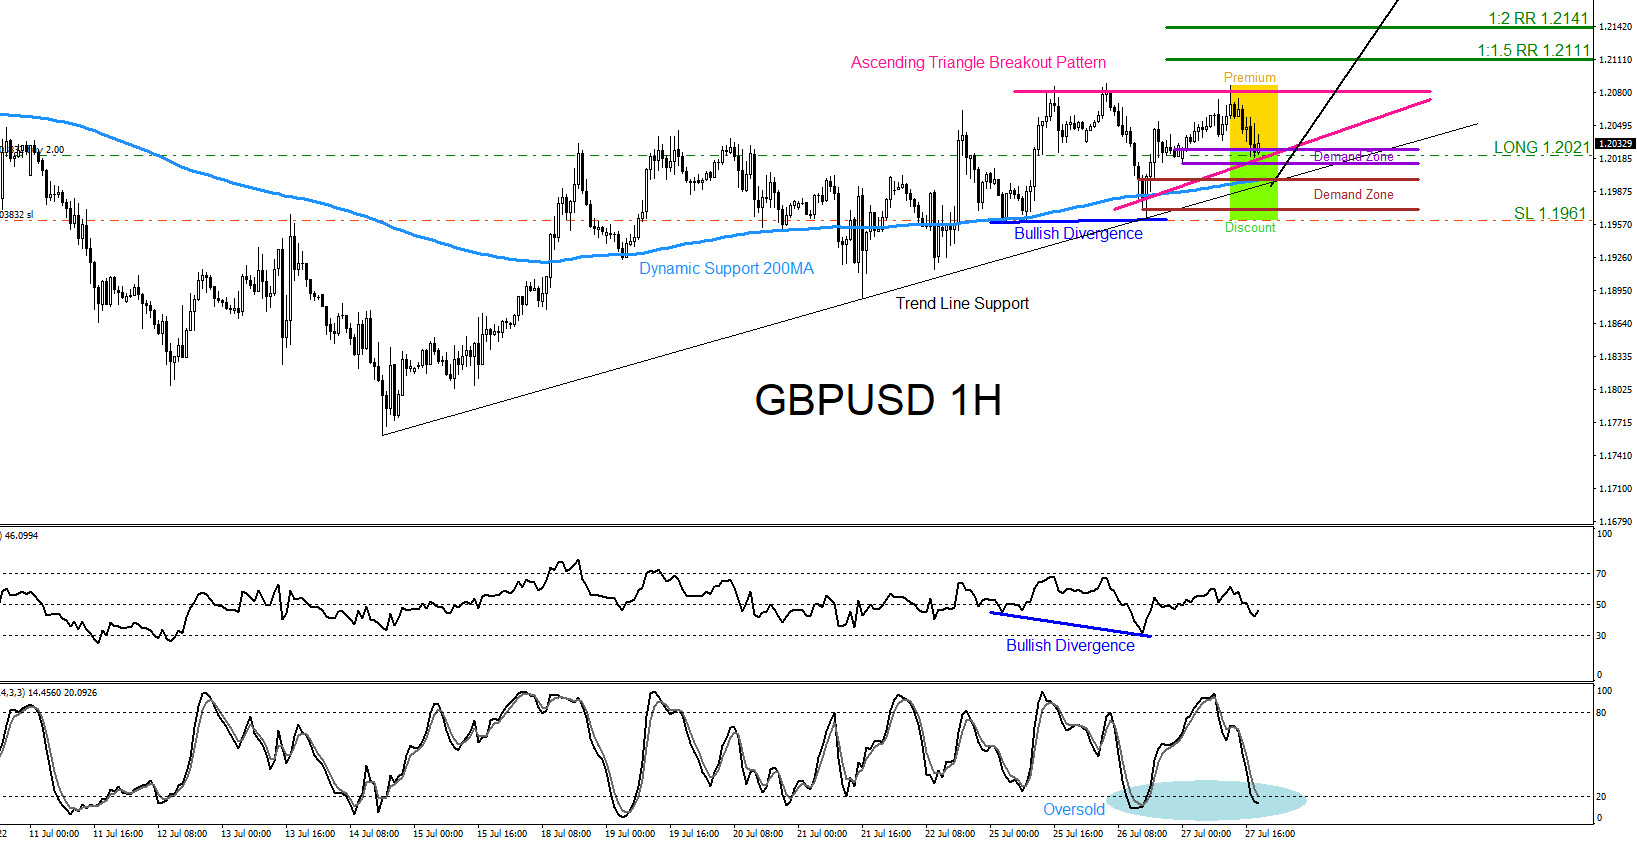
GBPUSD : Bullish Signals Calling the Move Higher
Read MoreOn July 26 2022 I posted on social media @AidanFX “ GBPUSD Watch for buying opportunities against 1.1962 stop loss.“ Confluence trading is a combination of two or more trading strategies/techniques that come together and form a high probability buy/sell zone in a certain area in the market. Market patterns (Elliott Waves, Harmonic, Head and […]
-
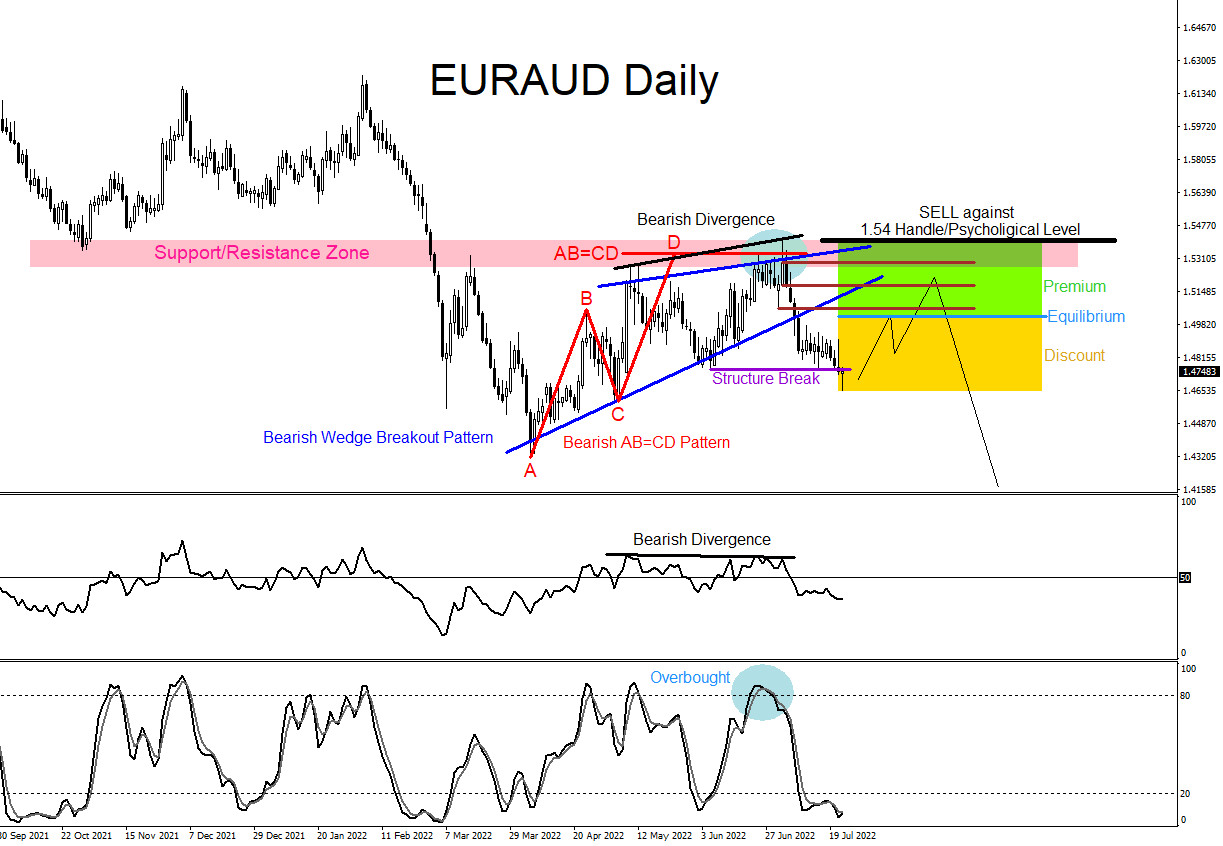
EURAUD : Watch for Selling Opportunities?
Read MoreThe chart below of the EURAUD pair is currently trending to the down side making lower lows and lower highs. The pair has been trending lower since it topped out on March 19 2020. If looking to trade EURAUD, traders should be patient and wait for price to push higher. Waiting for price to push […]