-

EURUSD : Watch for Sell Opportunities
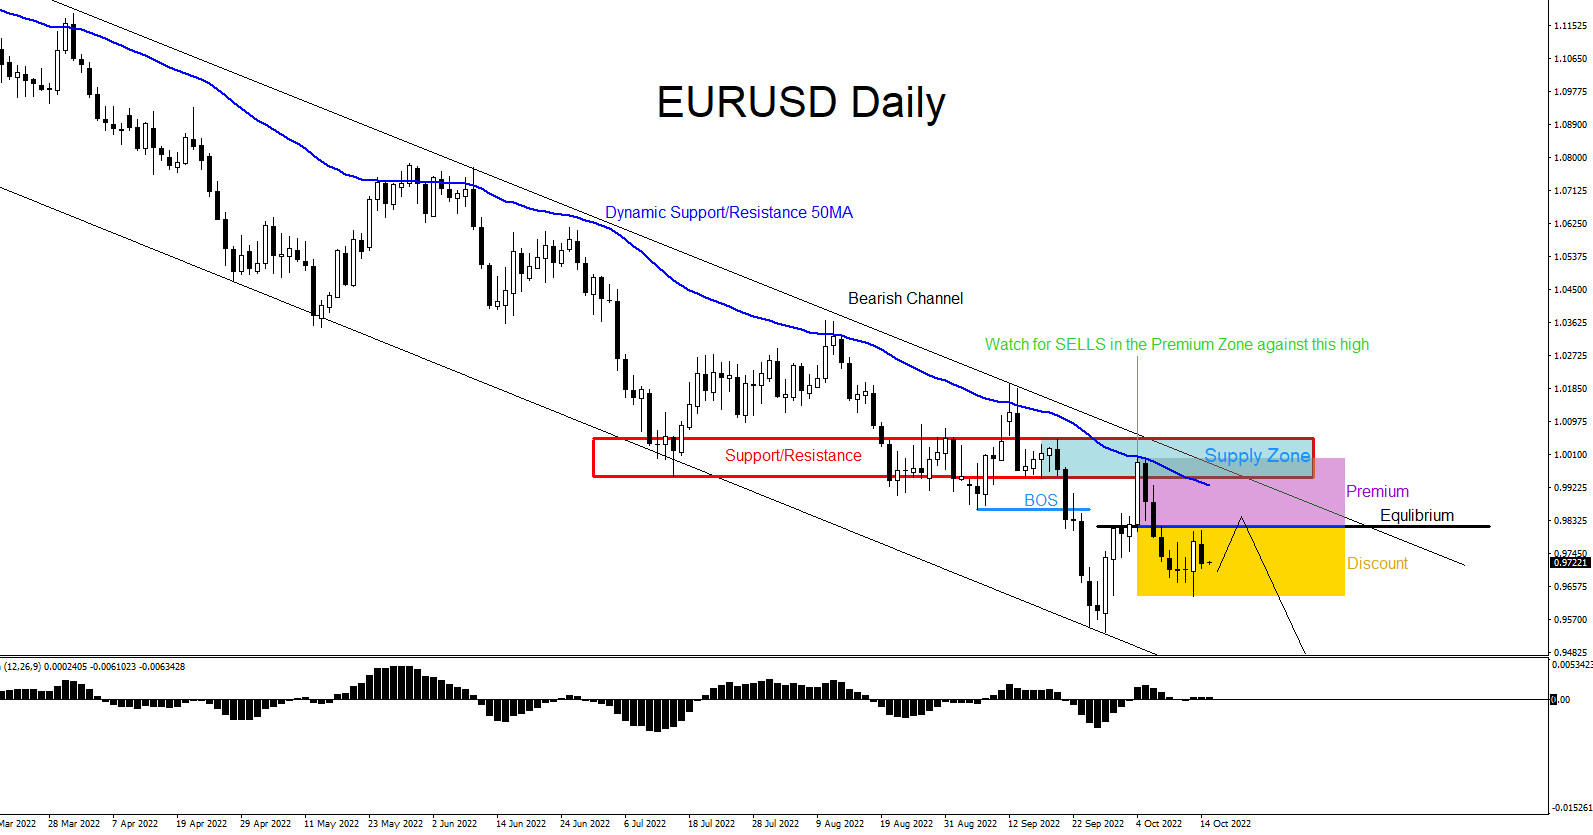
Read MoreThe chart below of the EURUSD pair is currently trending to the down side making lower lows and lower highs. If looking to trade EURUSD , traders should be patient and wait for price to push higher. Waiting for price to push higher above the equilibrium level (Black) and into the premium sell zone (Purple) […]
-

GBPUSD : Sell Trade Hits Targets
Read MoreOn September 27 2022 I posted on social media @AidanFX “ SHORT/SELL GBPUSD at 1.0788 Stop Loss at 1.0848 TP 1.0668 (1:2 RR) 1.0608 (1:3 RR)“ Confluence trading is a combination of two or more trading strategies/techniques that come together and form a high probability buy/sell zone in a certain area in the market. Market […]
-

EURJPY : Moves Lower as Expected
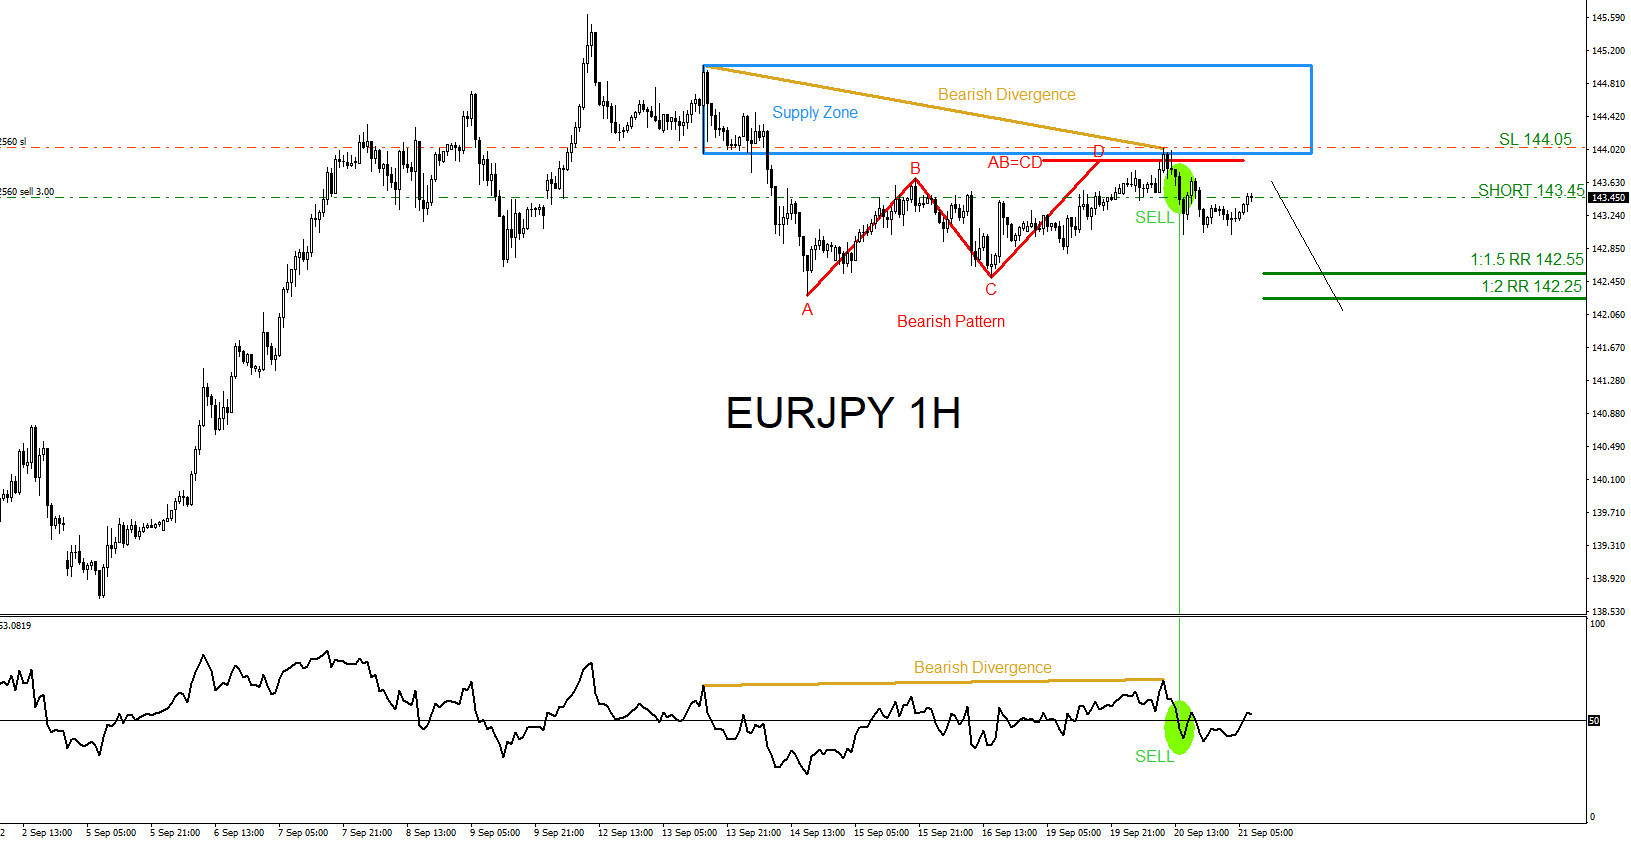
Read MoreOn September 21 2022 I posted on social media @AidanFX “ SOLD EURJPY at 143.45 Stop Loss at 144.05 TP 142.55 (1:1.5 RR) 142.25 (1:2 RR)“ Confluence trading is a combination of two or more trading strategies/techniques that come together and form a high probability buy/sell zone in a certain area in the market. Market […]
-

EURUSD : Sell Trade Hits Targets
Read MoreOn September 15 2022 I posted on social media @AidanFX “ SHORT/SELL EURUSD at 1.0005 Stop Loss at 1.0025 TP 0.9965 (1:2 RR) 0.9945 (1:3 RR)“ Confluence trading is a combination of two or more trading strategies/techniques that come together and form a high probability buy/sell zone in a certain area in the market. Market […]
-

EURAUD : Moves Higher as Expected
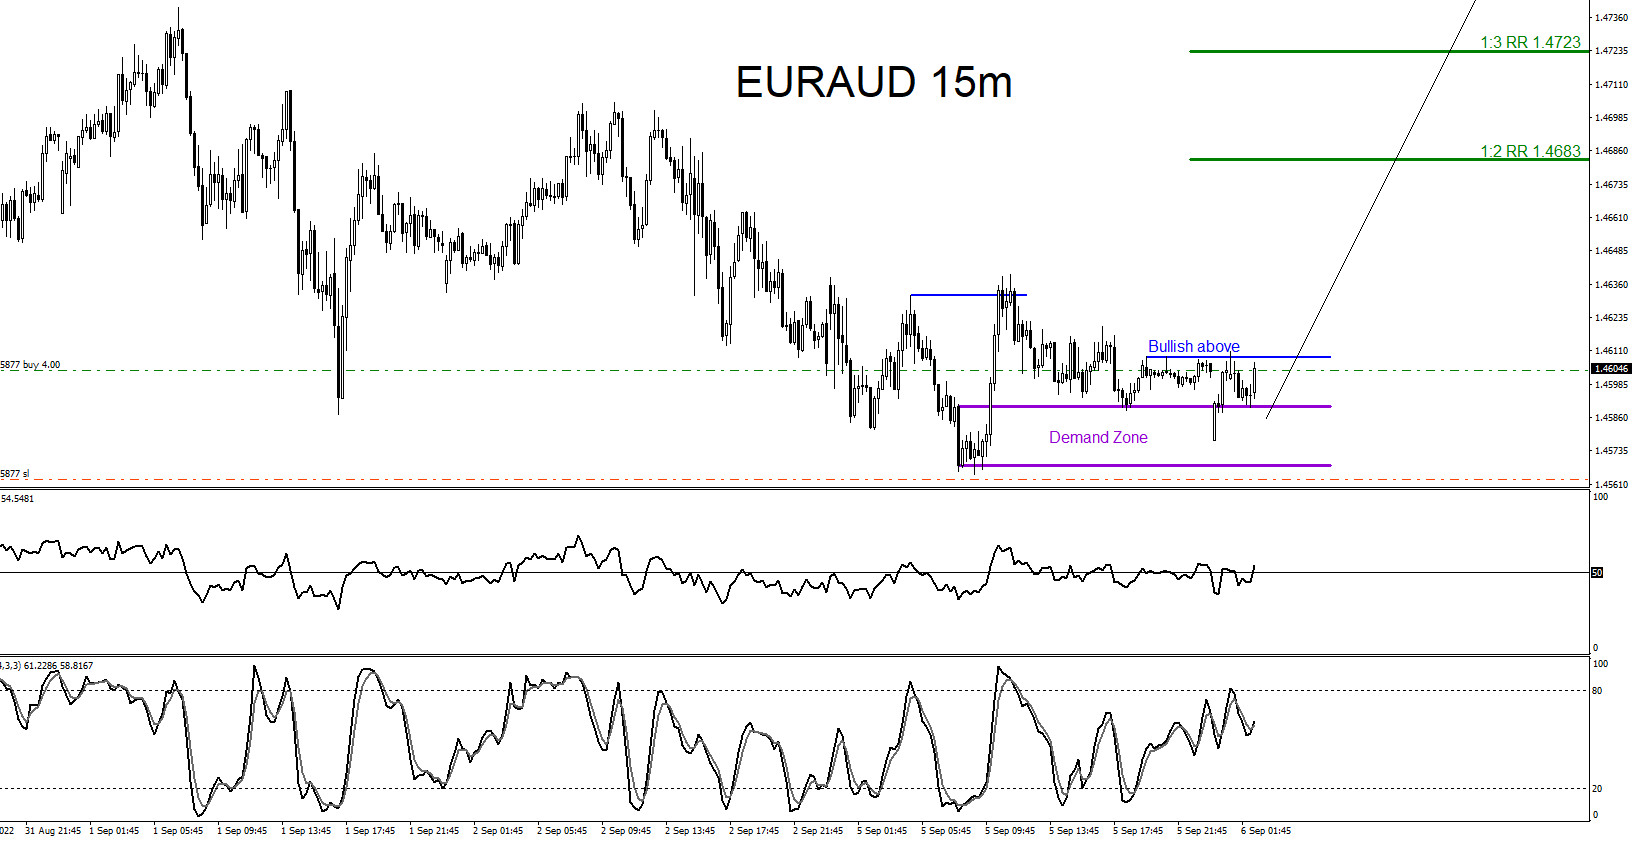
Read MoreOn September 5 2022 I posted on social media @AidanFX “ EURAUD BUY at 1.4603 Stop Loss 1.4563 TP 1.4683 (1:2RR) 1.4723 (1:3RR)“ Confluence trading is a combination of two or more trading strategies/techniques that come together and form a high probability buy/sell zone in a certain area in the market. Market patterns (Elliott Waves, […]
-

EURJPY : Higher Time Frame Analysis, Lower Time Frame Entry
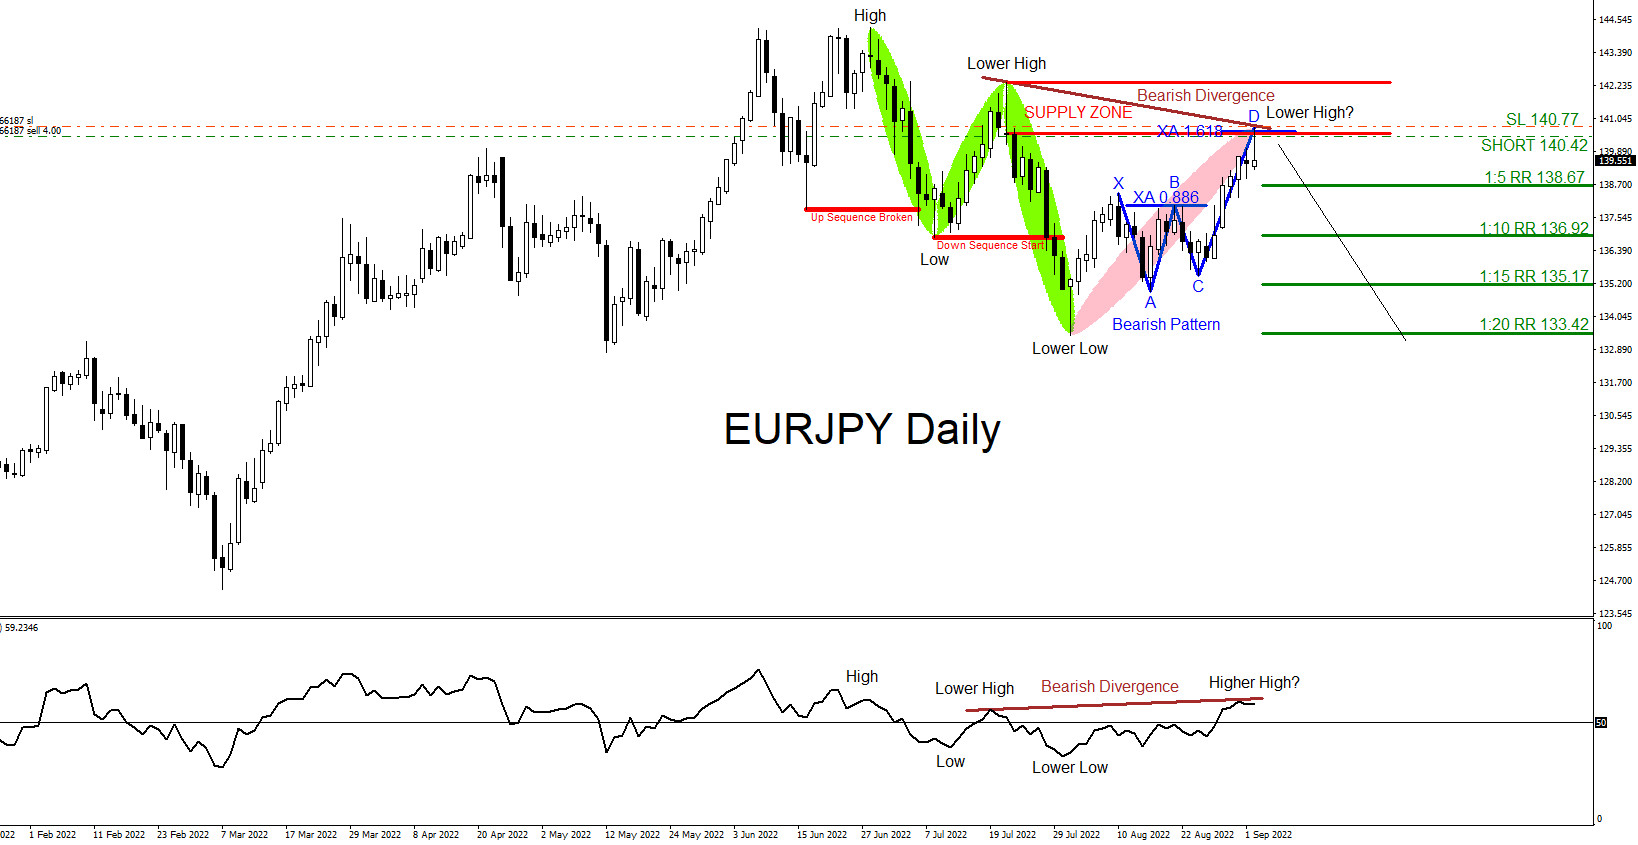
Read MoreOn September 2 2022 the EURJPY pair entered a confluence zone and signalled a high probability SELL trade setup. Confluence trading is a combination of two or more trading strategies/techniques that come together and form a high probability buy/sell zone in a certain area in the market. Market patterns (Elliott Waves, Harmonic, Head and Shoulders, […]