
-
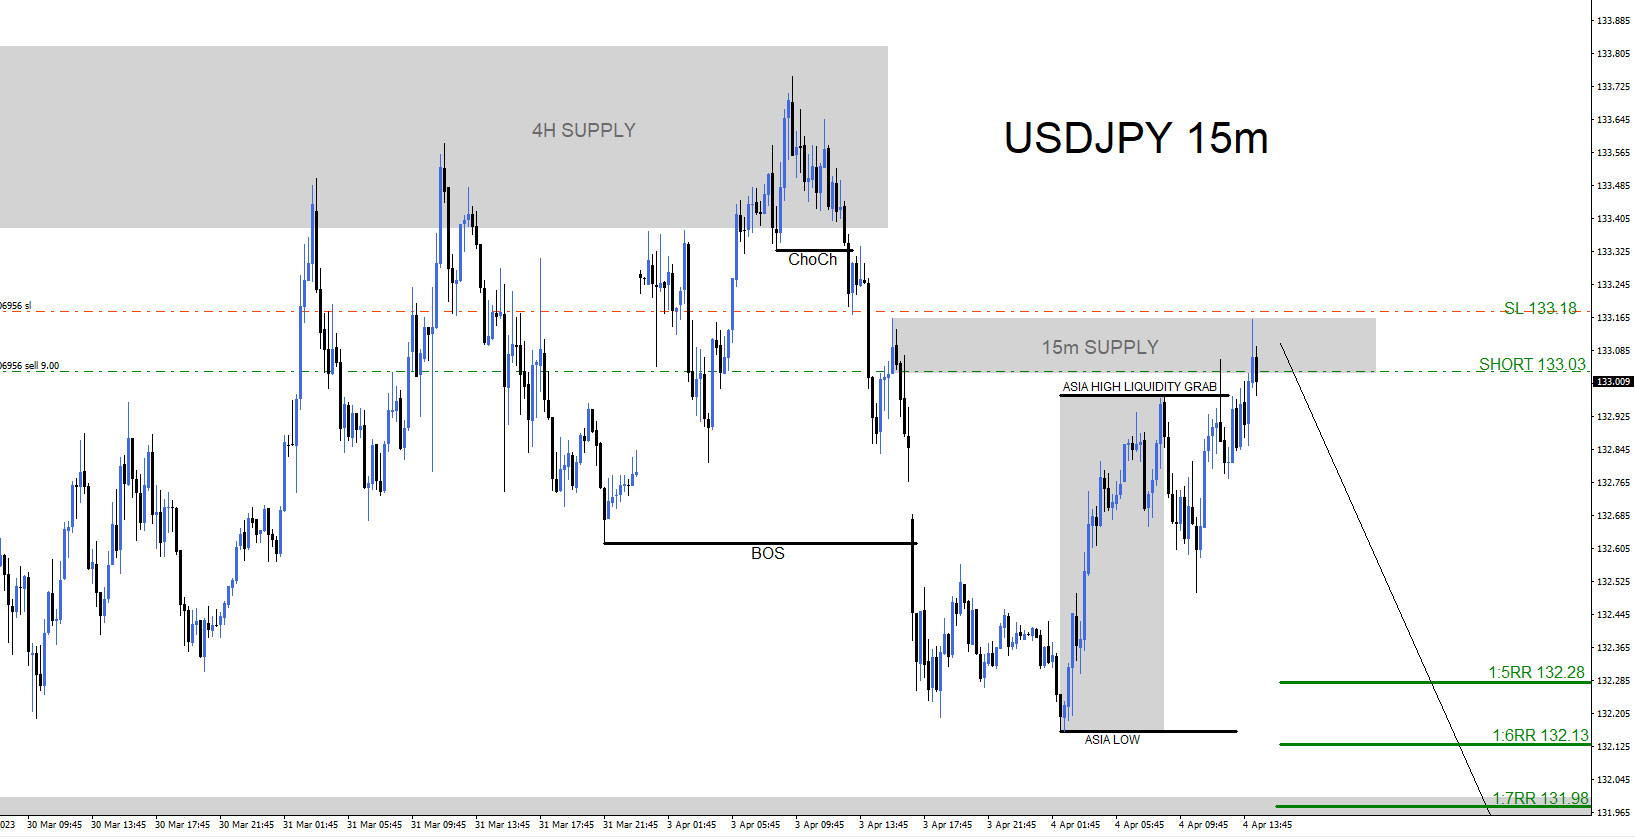
USDJPY : Sell Trade Hits Targets
Read MoreOn April 4 2023 I posted on social media @AidanFX ” USDJPY will look for sells against 133.18 stops targeting the 132.28 – 131.98 area.” SELL Trade Setup 1. Price reacted lower from the 4 hour supply zone signalling more downside. 2. Price breaks below internal structure lower highs (ChoCh and BOS Black Line) signalling […]
-
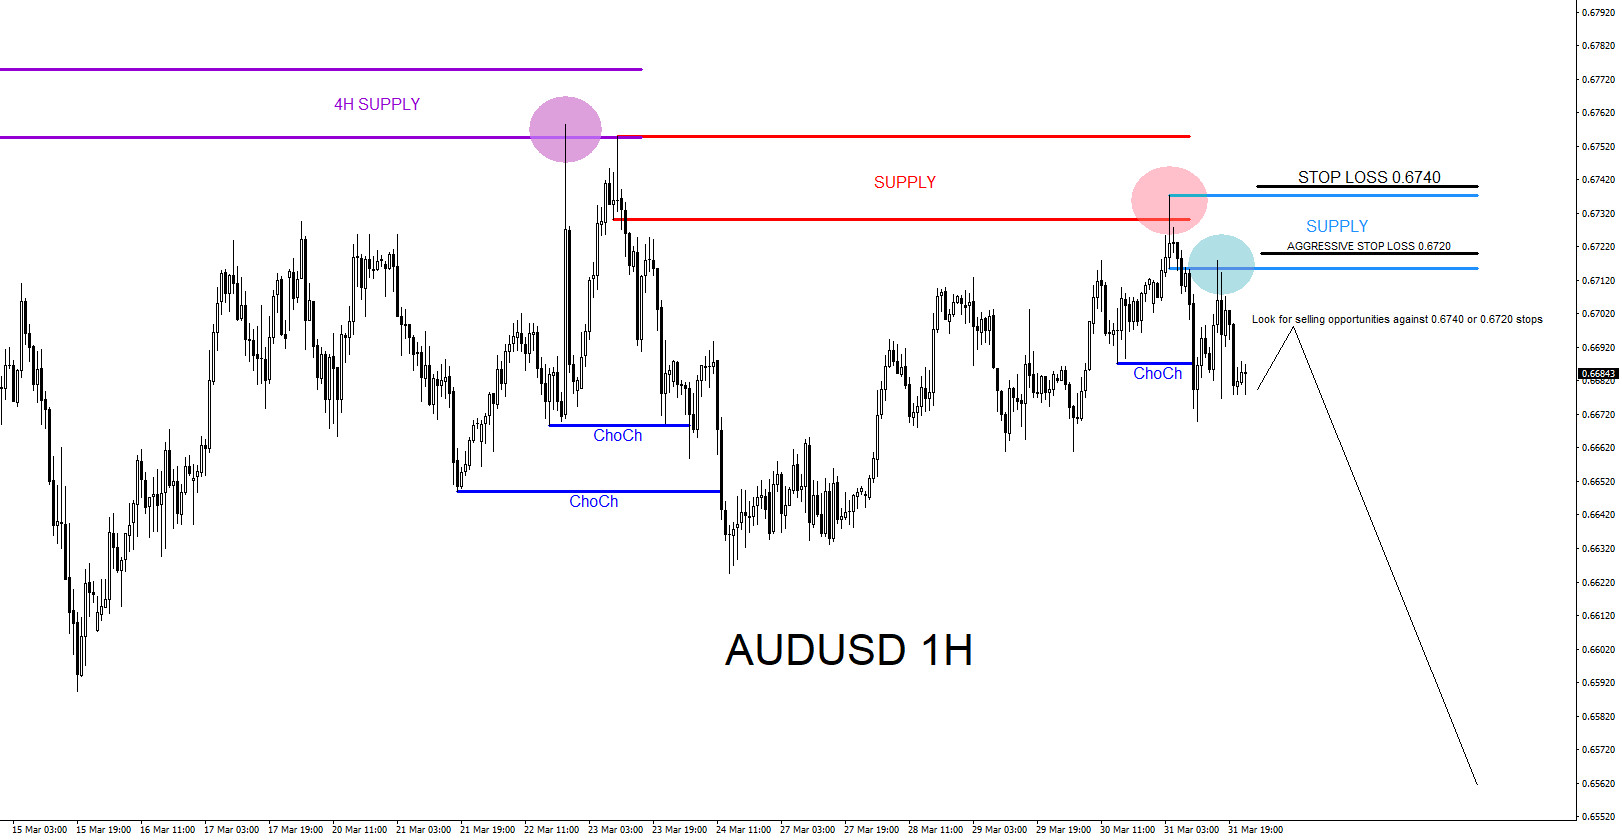
AUDUSD : Sell Trade Setup
Read MoreAt the moment AUDUSD is currently pushing lower from when it topped out on February 2 2023. Looking at the 4 hour chart below we can see and could still expect for the pair to continue pushing lower on reasons that the pair is currently in a lower low / lower high sequence. Price has […]
-
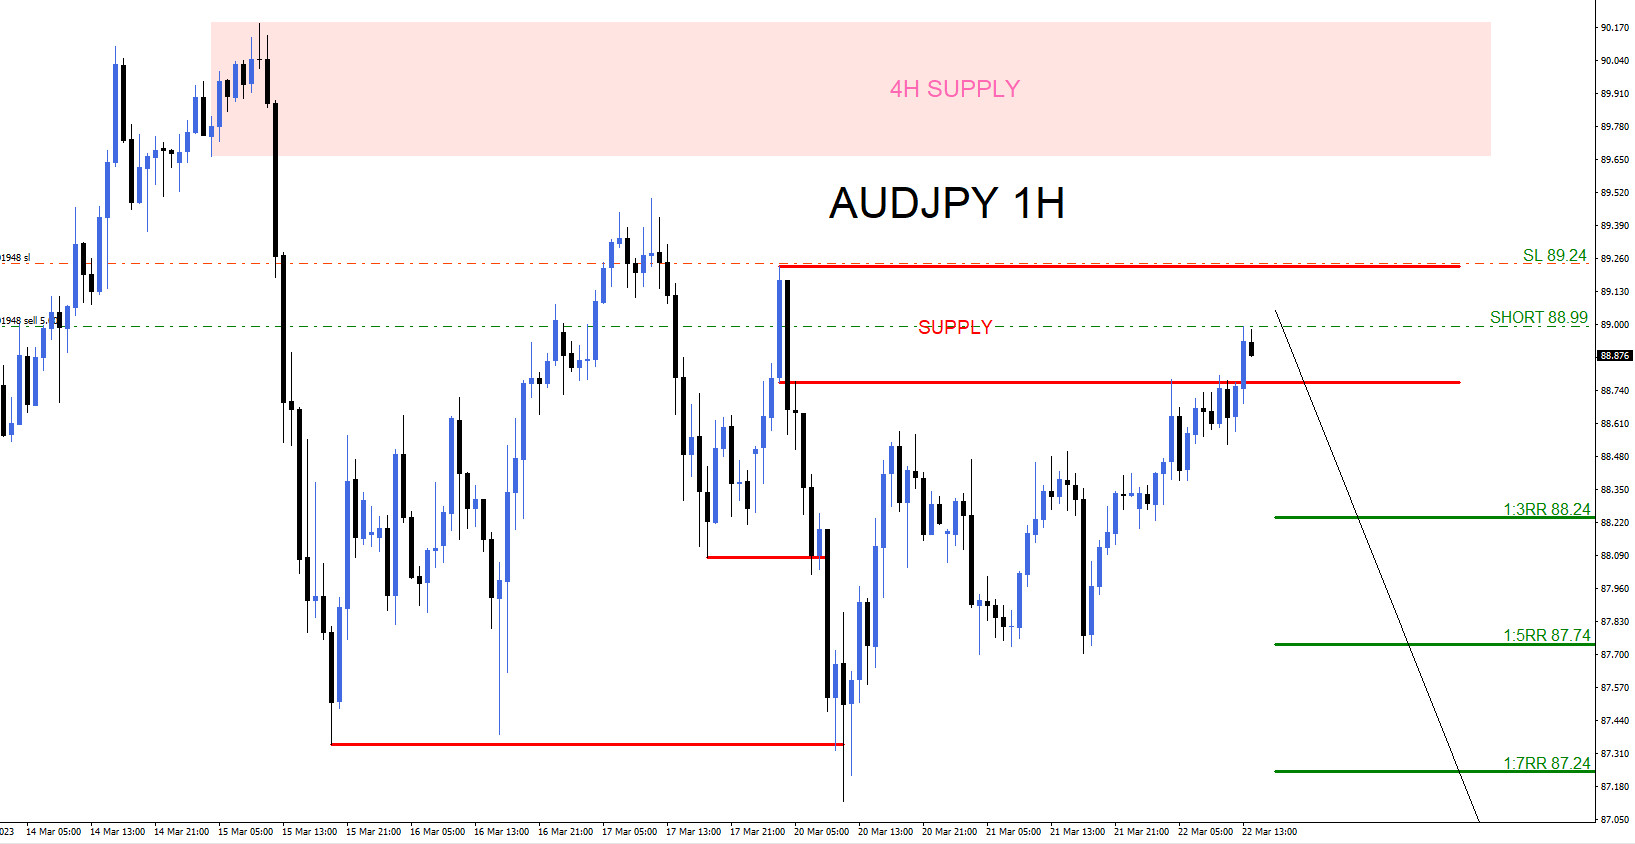
AUDJPY : Sell Trade Hits Targets
Read MoreSince February 14 2023, AUDJPY has been trending to the downside making lower lows and lower highs. Knowing that the pair is on a down trend it would only make sense for a trader to look for possible sell trade setups. On March 21 2023 I posted the AUDJPY 1 hour chart on social media […]
-
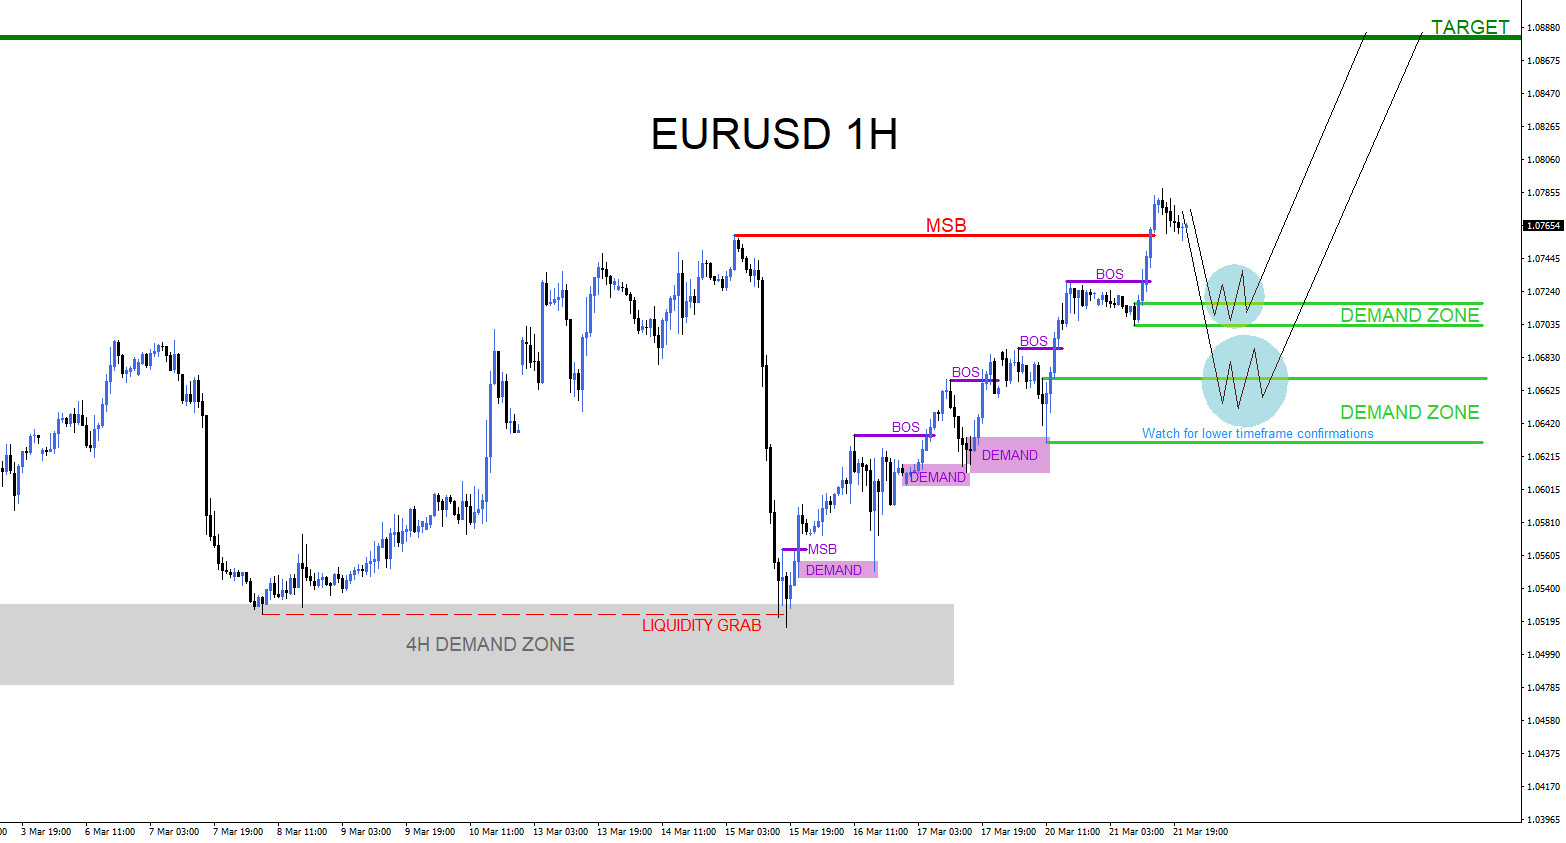
EURUSD : Possible Buy Zones
Read MoreAt the moment EURUSD is currently pushing higher from the March 15 2023 low. Short term intraday analysis is signalling that the pair can still continue higher. Price has broke above the March 15 high (red MSB) on the 1 hour chart while the pair has been making higher highs and higher lows signalling a […]
-
AUDJPY : Moved Lower as Expected
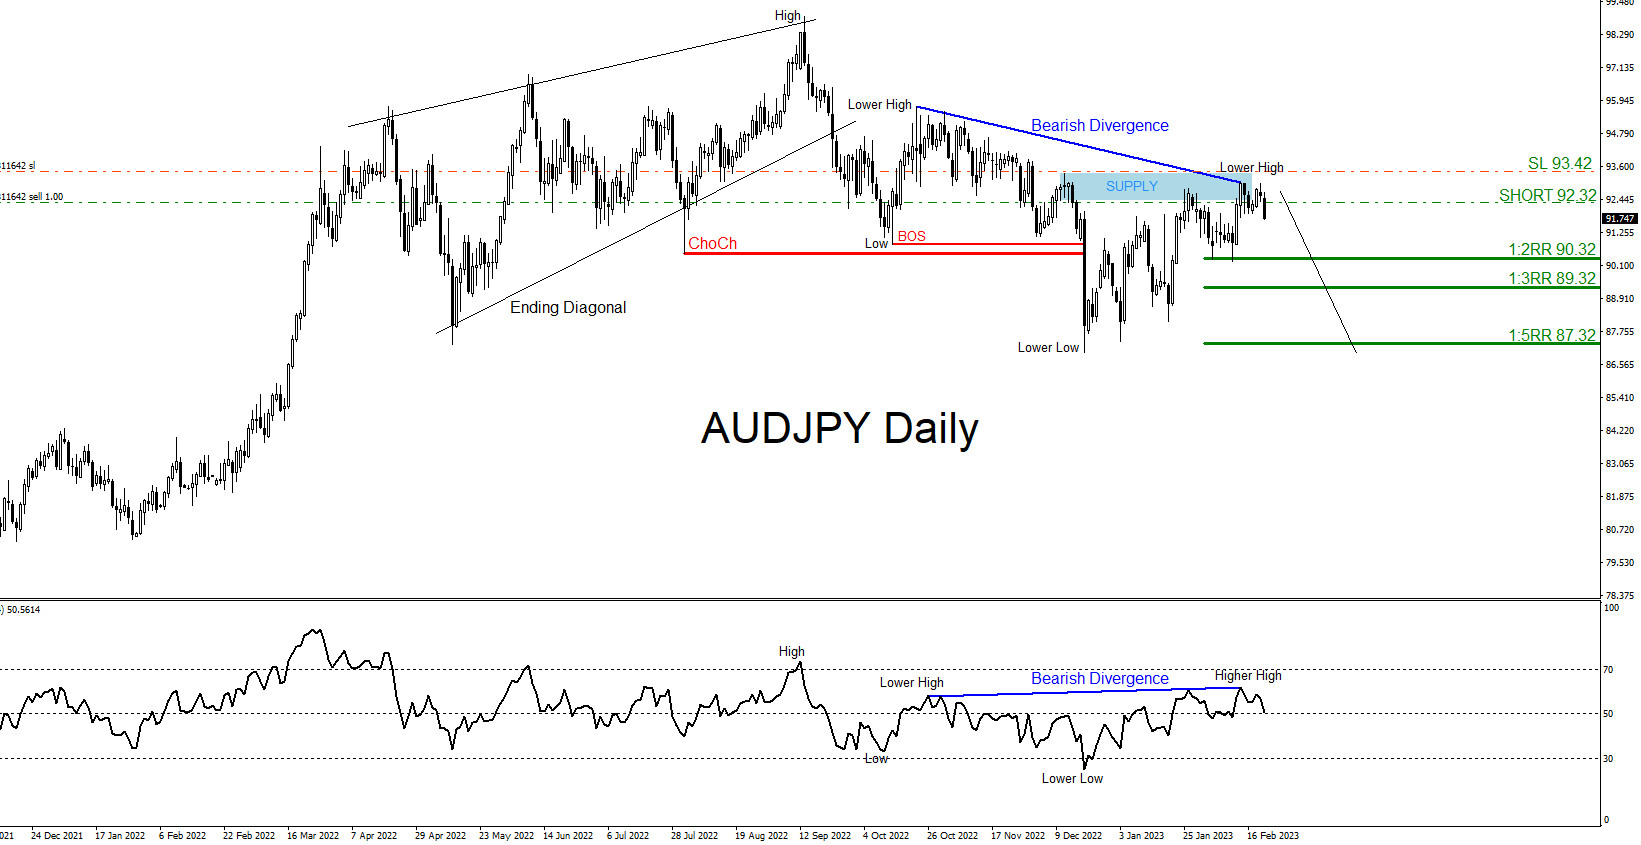
Read MoreOn January 31 2023 I published the article: AUDJPY : Possible Move Lower? calling for the pair to top out and reverse lower. There were several market patterns and signals calling for a move lower. SELL Trade Setup 1. Ending diagonal pattern calling for reversal lower. (Black) 2. Price trending lower making a lower low […]
-
XAUUSD : Will Gold Find Support and Bounce Higher?
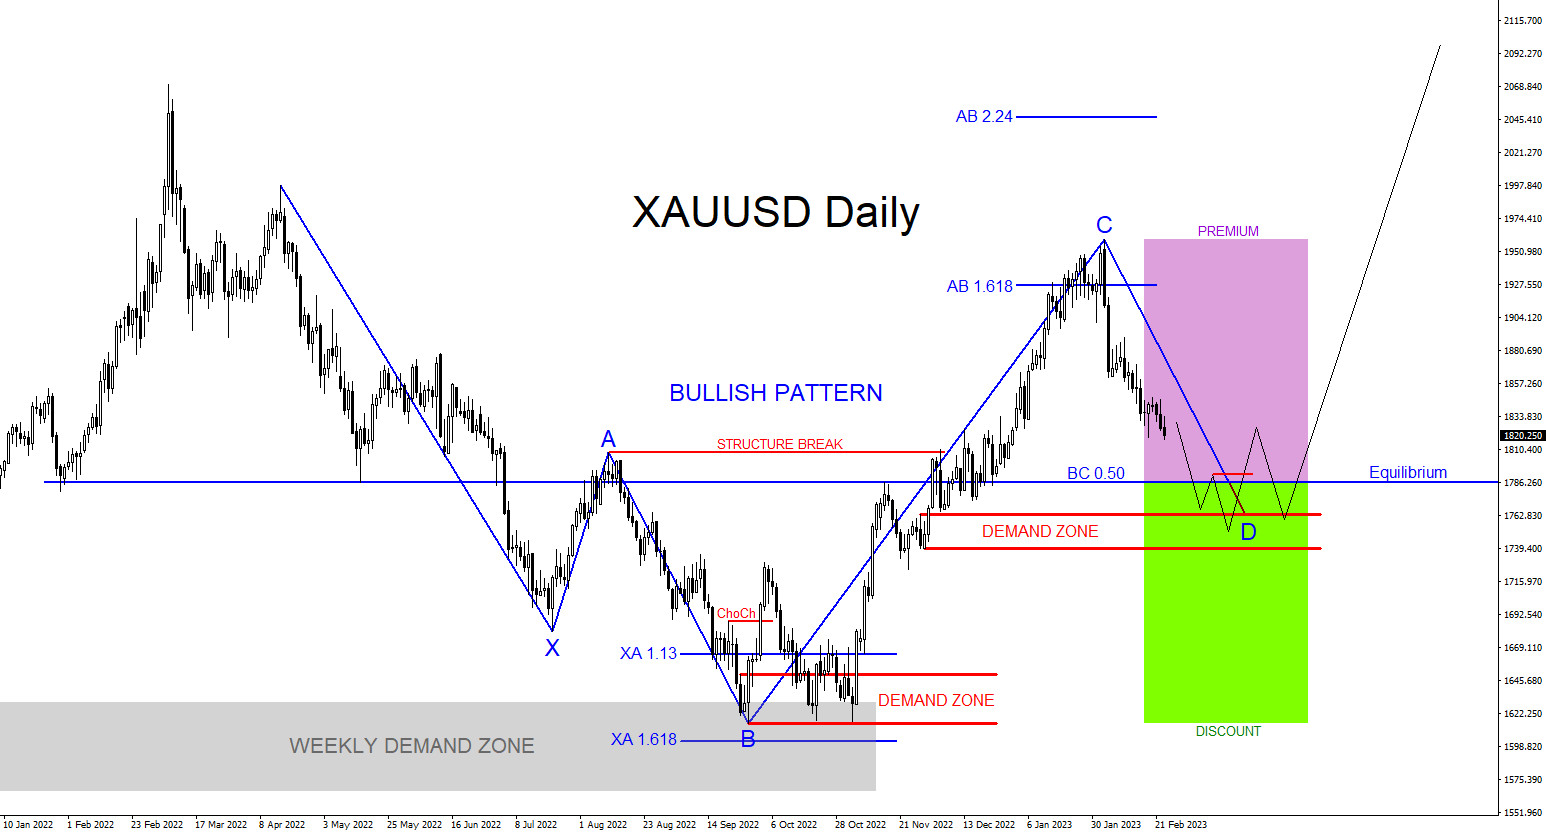
Read MoreA bullish pattern is visible on the XAUUSD Daily time frame. The blue bullish pattern still needs to make a push lower to complete point D at the BC 0.50% Fib. retracement level where gold can possibly find support and find buyers to push the price higher. There is a demand zone (Red) below the […]