GBPUSD Technical Analysis
GBPUSD : On September 3/2019 the pair found a bottom and has bounced higher since. GBPUSD has been making higher highs and higher lows from the September 3/2019 lows indicating that the pair is trending to the upside. Trading with the trend is always recommended at EWF. Near the start of December 2019 I started posting on social media that a visible bullish triangle pattern was forming and to watch for a break higher. Triangle breakouts usually offer a strong and fast thrust on the break.
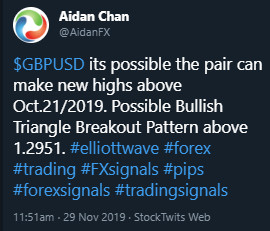
StockTwits/Twitter November 29/2019
Posted on social media that the bullish triangle pattern was forming and visible. Also posted the level to watch for the breakout (1.2951).
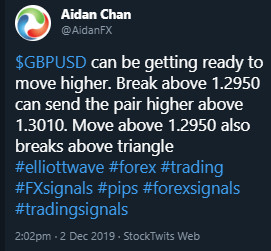
StockTwits/Twitter December 2/2019
Posted on social media price broke above triangle and the key breakout level where more bulls/buyers will enter the market to push price higher (1.2950)
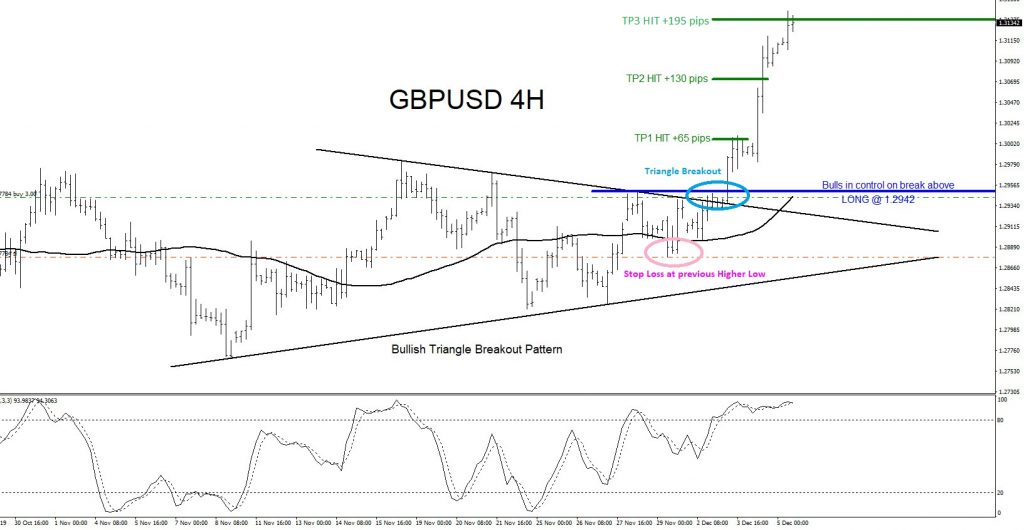
GBPUSD 4 Hour Chart 12.5.2019
The chart below shows the 4 hour bullish triangle breakout pattern. The pattern was clearly visible and when price broke above the triangle breakout level at 1.2950 GBPUSD pushed hard to the upside hitting my 1:3 RR Target for +195 pips.
Of course, like any strategy/technique, there will be times when the strategy/technique fails so proper money/risk management should always be used on every trade. Hope you enjoyed this article and follow me on Twitter for updates and questions> @AidanFX or chat me on Skype > EWF Aidan Chan
*** Always use proper risk/money management according to your account size ***
At Elliottwave-Forecast we cover 78 instruments (Forex, Commodities, Indices, Stocks and ETFs) in 4 different timeframes and we offer 5 Live Session Webinars everyday. We do Daily Technical Videos, Elliott Wave Trade Setup Videos and we have a 24 Chat Room. Our clients are always in the loop for the next market move.
Try Elliottwave-Forecast for 14 days FREE !!! Just click here –> 14 day FREE trial
Back


