GBPUSD Technical Analysis
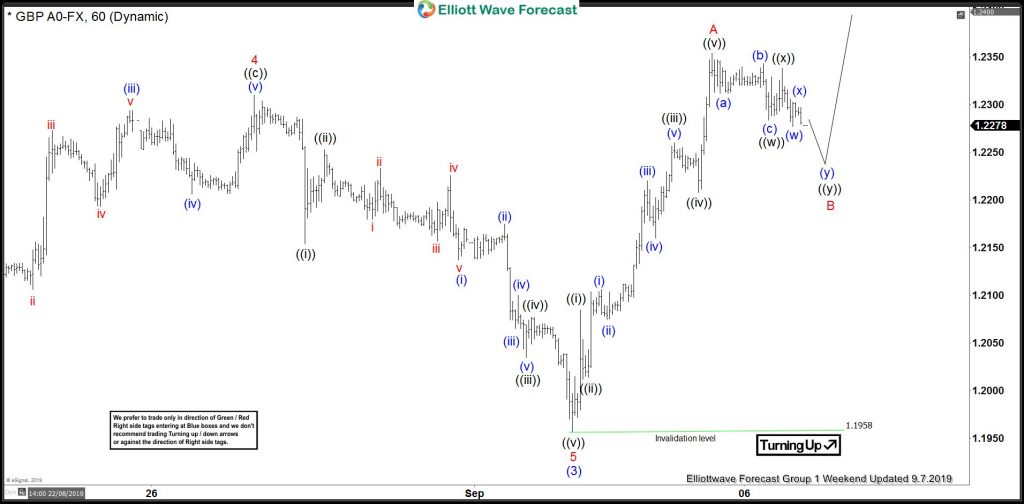
Using Elliott Waves to forecast the markets can allow a trader to decide which side to trade. Tracking GBPUSD at the start of the trading week (September 8/2019 – September 13/2019) we saw that there was a possible wave count that was calling the pair to trade higher. Before the start of the trading week we posted the chart below, in our members only area, advising our clients/members to watch for a possible move higher in the coming trading days.
GBPUSD 1 Hour Weekend Update Chart September 7/2019
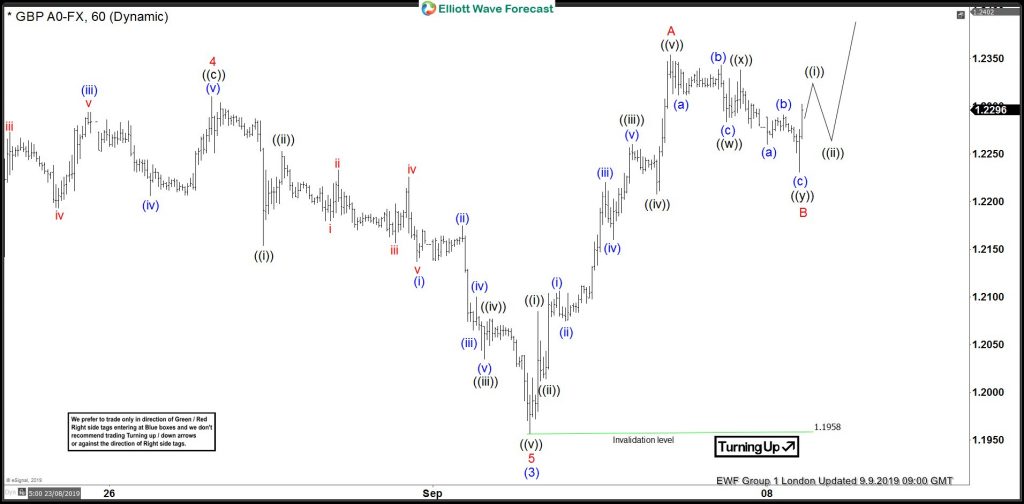
The chart below shows GBPUSD terminated red wave B September 9/2019 which was followed by a bounce higher signalling that the correction lower possibly terminated and the pair would then extend higher. The invalidation level was quite far so conservative traders needed to wait for more confirmation that the red wave B has terminated. Aggressive traders could have taken the BUY on the red wave B down move but stop losses would have been wide.
GBPUSD 1 Hour Chart London Update September 9/2019
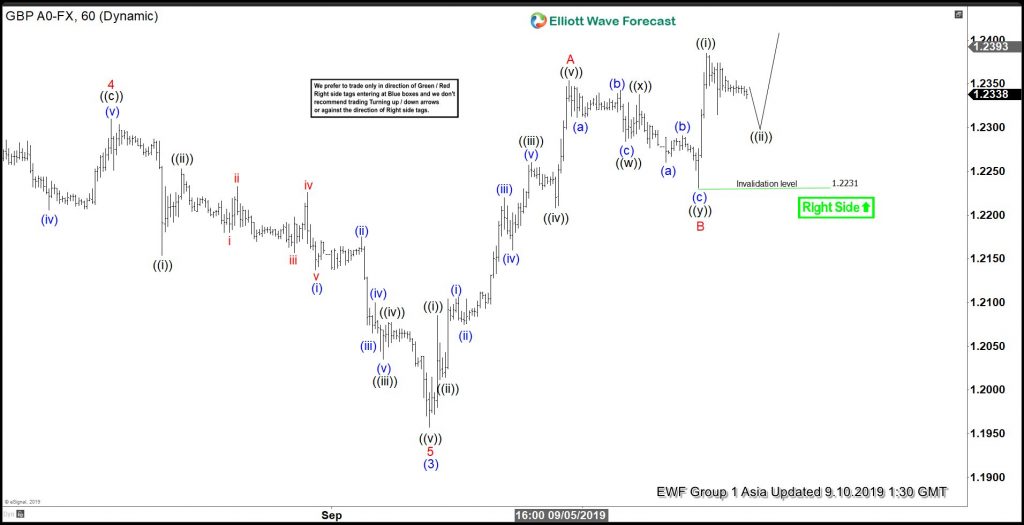
GBPUSD continued higher and retraced lower determining that the small bounce higher would be the possible wave ((i)) of the higher degree red wave C. On September 10/2019 we advised clients/members that now was a good time to start looking for BUYS/LONGS against the invalidation level. In the chart below traders now saw that the low of red wave B must hold if any rally higher would happen. Placing the invalidation level at the red wave B low would allow our clients/members to enter the market with tighter stops.
GBPUSD 1 Hour Chart Asia Update September 10/2019
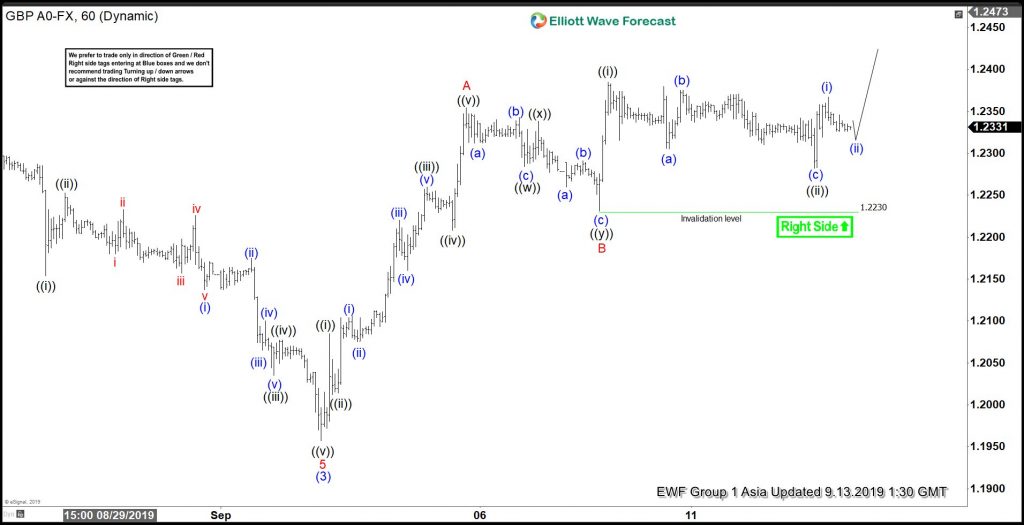
In the chart below, we advised clients/members that wave ((ii)) correction terminated and the pair would push higher. We continued to encourage our clients/members to BUY/LONG the pair with stop loss at the invalidation level.
GBPUSD 1 Hour Chart Asia Update September 13/2019
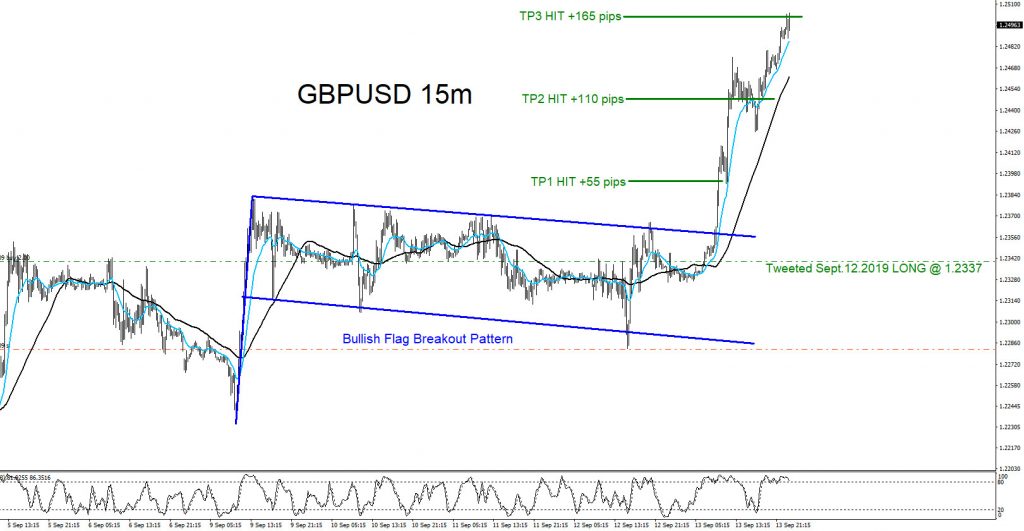
On September 12/2019 I posted on Twitter @AidanFX the BUY/LONG entry at 1.2337 with stop loss at 1.2282 of the wave ((ii)) low. The Bullish Flag Market Pattern in the chart below together with our Elliott Wave charts above clearly showed that the break above the top of flag trend line will push GBPUSD higher. The pair moved higher and has hit the TP3 target (1:3 R/R target) for +165 pips. Using Elliottwave-Forecast charts to determine which side to trade and combining market patterns to match the Elliott Wave count allows a trader to catch moves and bank PIPS. Try Elliottwave-Forecast for 14 days FREE !!! Just click here –> 14 day FREE trial
GBPUSD 15 Minute Chart September 13/2019
Of course, like any strategy/technique, there will be times when the strategy/technique fails so proper money/risk management should always be used on every trade. Hope you enjoyed this article and follow me on Twitter for updates and questions> @AidanFX or chat me on Skype > EWF Aidan Chan
*** Always use proper risk/money management according to your account size ***
At Elliottwave-Forecast we cover 78 instruments (Forex, Commodities, Indices, Stocks and ETFs) in 4 different timeframes and we offer 5 Live Session Webinars everyday. We do Daily Technical Videos, Elliott Wave Trade Setup Videos and we have a 24 Chat Room. Our clients are always in the loop for the next market move.
Try Elliottwave-Forecast for 14 days FREE !!! Just click here –> 14 day FREE trial
Back