GBPAUD has been trending higher on the 1 hour and 4 hour time frames since October 7/2016. Elliott Wave forecast analysis can also be calling for the pair to continue the trend and push higher. We at Elliottwave-Forecast always recommend our clients to trade with the trend and not against it. We also understand that Elliott Wave on it’s own is not enough to forecast so we combine other trading strategies to compliment the analysis as you will see in the charts below.
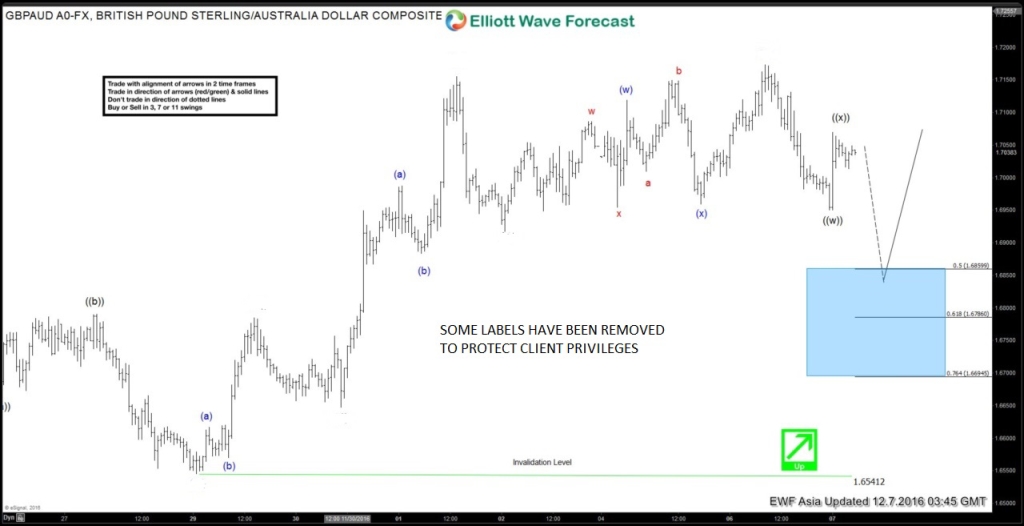
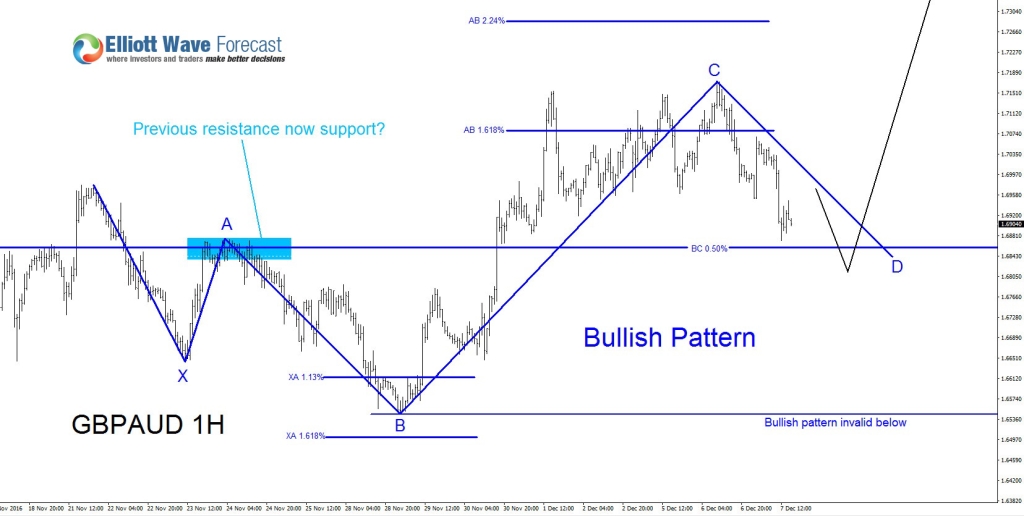
In the first chart an Elliott Wave correction lower is currently visible at the moment and we are expecting for the correction to end and possibly bounce and continue higher. The blue box is a good possible area where we expect the Elliott Wave correction to terminate and we should see GBPAUD bounce higher off this blue box. In the second chart below we show that a bullish pattern (Blue pattern) also triggers a BUY signal at the BC 0.50% Fib. retracement level. The blue bullish pattern triggers the buy in the same blue box area of the first chart thus making this area a good possible area where bulls will be positioning to push GBPAUD higher.
Only time will tell what GBPAUD will do but as long as price stays above the invalidation level at 1.6541 we can only anticipate that the pair will bounce and push higher.
GBPAUD 1 Hour Chart December 7/2016 (Asia Update)

GBPAUD 1 Hour Chart December 7/2016 (Bullish Pattern)

*** Always use proper risk/money management according to your account size ***
At Elliottwave-Forecast we cover 52 instruments (Forex, Commodities, Indices) in 4 different time frames and we offer 3 Live Session Webinars everyday. We do Daily Technical Analysis Videos, Elliott Wave Trade Setup Videos and we have a 24 Chat Room. Our clients are always in the loop for the next market move.
Try Elliottwave-Forecast for 14 days FREE !!! Just click here –> 14 day FREE trial
Back

