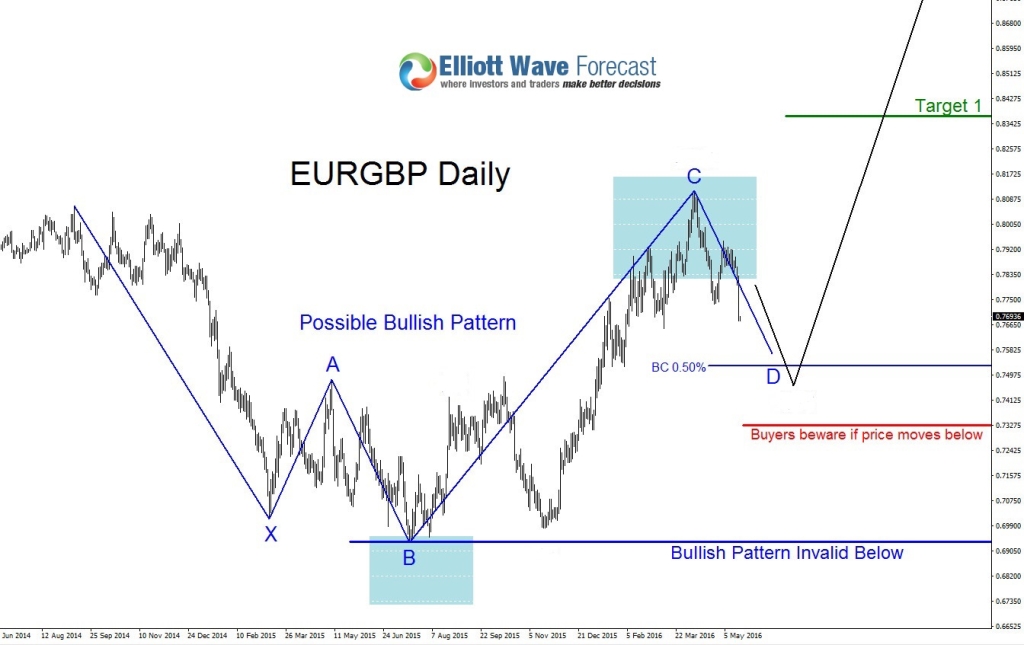
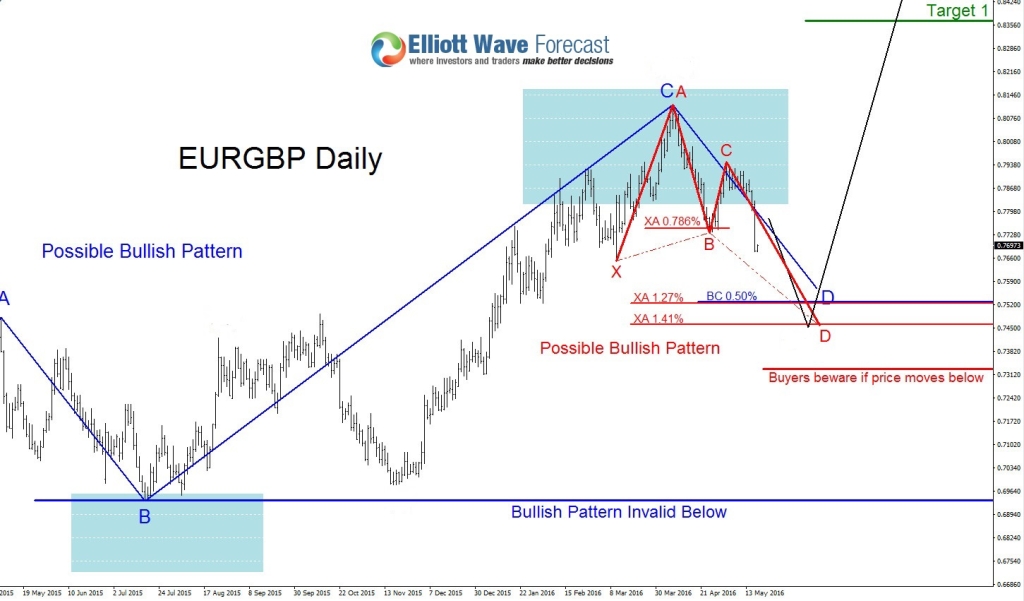
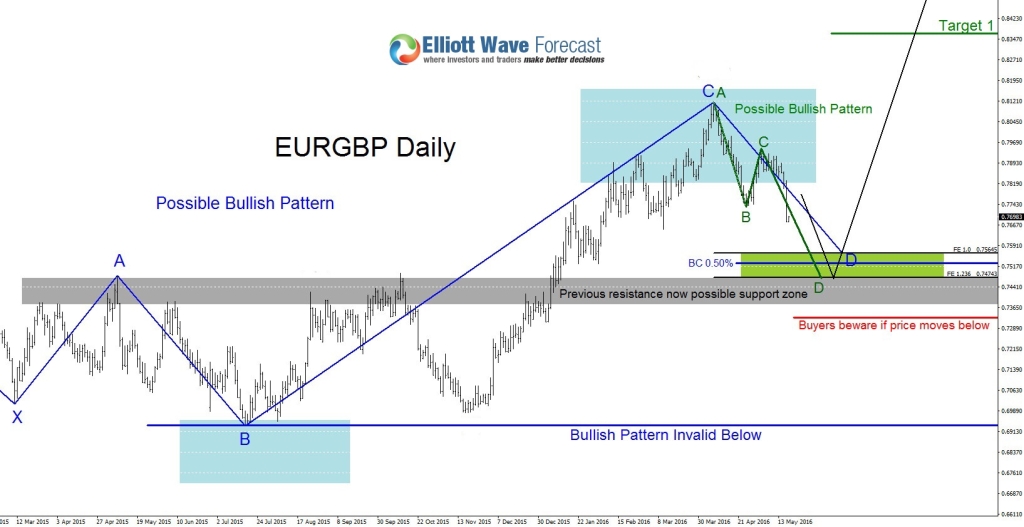
Since November 2015 EURGBP has been moving higher and on April 7 it has formed a top and reversed lower. The cycle from November 2015 low to April 2016 high has ended and is now at the moment correcting lower. We still expect another move higher but need to wait for signs that this current correction/cycle will be coming to an end. Below are some scenarios of where this current cycle that started on April 7/2016 can possibly terminate.
Possible Bullish Pattern (Blue) : On the chart below this possible bullish pattern triggers a buy when price hits the BC 0.50% Fib. retracement level. This level can possibly push EURGBP higher to new highs. There are other bullish patterns and signs that show that the BC 0.50% area can possibly be a strong support zone.
Possible Bullish Pattern (Red) : This possible bullish pattern triggers a buy when price enters the XA 1.27% – 1.41% Fib. retracement zone. As you can see on the chart below the XA 1.27% Fib. level is practically aligned to the blue BC 0.50% level showing that this will be strong area where EURGBP can possibly reverse higher.
Possible Bullish Pattern (Green) : This bullish pattern triggers a buy when price (Point D) enters the 1.0% – 1.236% Fib. expansion levels where points AB=CD (Equal legs). As you can see on the chart below this green bullish pattern also triggers near the blue BC 0.50% Fib. retracement level again showing that this is a strong area where EURGBP can possibly reverse higher. Also a possible support zone (Grey) can add more evidence that EURGBP can possibly bounce at this zone.
As long as EURGBP stays above July 17/2015 low (0.6934) we expect another move higher towards the 0.8365 1st Target level. A break below 0.6934 will invalidate the Blue bullish pattern and a break below 0.7320 will invalidate the Red and Green bullish patterns.
If looking to buy EURGBP stops should be placed at 0.7320 (*Red* Buyers beware level) and should be bought below 0.7525 minimum for a better risk/reward trade. 1st Target 0.8365 2nd Target Open.
*** Always use proper risk/money management according to your account size ***
At Elliottwave-Forecast we cover 50 instruments (Forex, Commodities, Indices) in 4 different timeframes and we offer 3 Live Session Webinars everyday. We do Daily Technical Videos, Elliott Wave Trade Setup Videos and we have a 24 Chat Room. Our clients are always in the loop for the next market move.
Try Elliottwave-Forecast for 14 days FREE !!! Just click here –> 14 day FREE trial
Back


