EURAUD Technical Analysis 1.25.2018
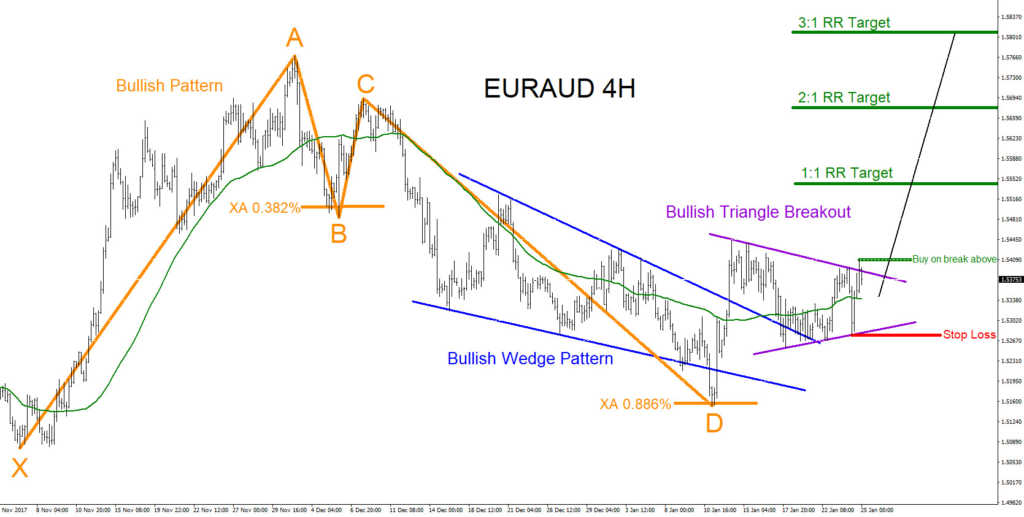
EURAUD has potential to push higher. Bullish patterns are visible and just waiting for price to start rallying to the upside. On the chart below the orange bullish pattern already triggered buys at the XA 0.886% Fib. retracement level and bounced higher. On the bounce higher the pair broke above the blue bullish wedge pattern where EURAUD can now possibly be starting a bullish sequence. Break above the purple bullish triangle pattern can trigger more buyers/bulls to join in and can cause EURAUD to start rallying higher. Any possible buying should be on the breakout above the purple triangle pattern at the 1.5411 level and stop loss should be at 1.5278. A break below 1.5278 will trigger more sellers/bears and push price lower. Price needs to stay above 1.5278 for the pair to extend higher towards the 2017 December high and possibly breaking above that level. Only time will tell which way the market will go but for now the bullish scenario is highly possible.
EURAUD 4 Hour Chart 1.24.2018
Of course, like any strategy/technique, there will be times when the strategy/technique fails so proper money/risk management should always be used on every trade. Hope you enjoyed this article and follow me on Twitter for updates and questions> @AidanFX or chat me on Skype > EWF Aidan Chan
*** Always use proper risk/money management according to your account size ***
At Elliottwave-Forecast we cover 76 instruments (Forex, Commodities, Indices, Stocks and ETFs) in 4 different timeframes and we offer 5 Live Session Webinars everyday. We do Daily Technical Videos, Elliott Wave Trade Setup Videos and we have a 24 Chat Room. Our clients are always in the loop for the next market move.
Try Elliottwave-Forecast for 14 days FREE !!! Just click here –> 14 day FREE trial
Back

