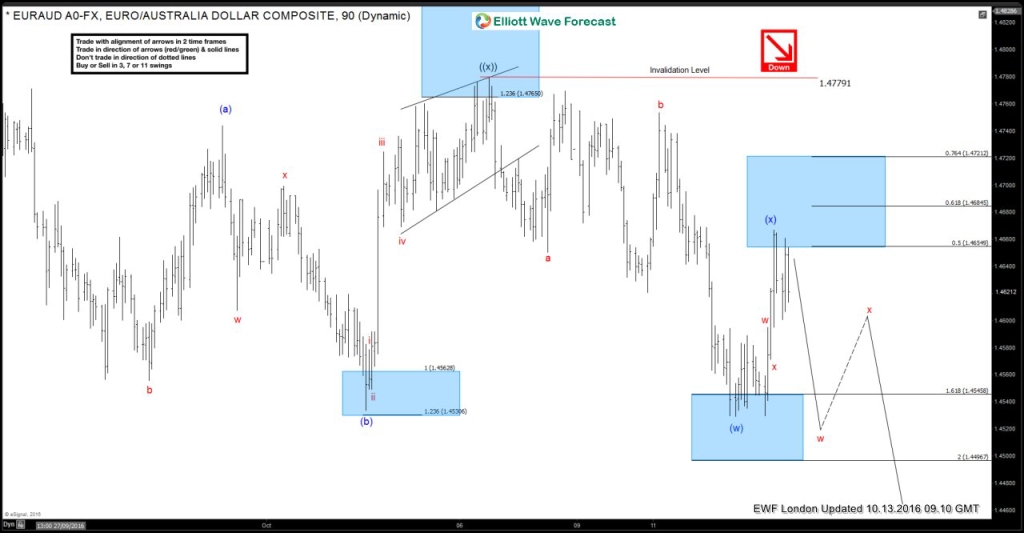
On October 13/2016, during our London update, we advised our members that EURAUD did a 3 swing correction pullback on the 1 hour chart and the pair can now continue lower. In the chart below, EURAUD saw rejection at the 0.50% Fibonacci retracement level and we clearly see a reaction from this Fib. level.
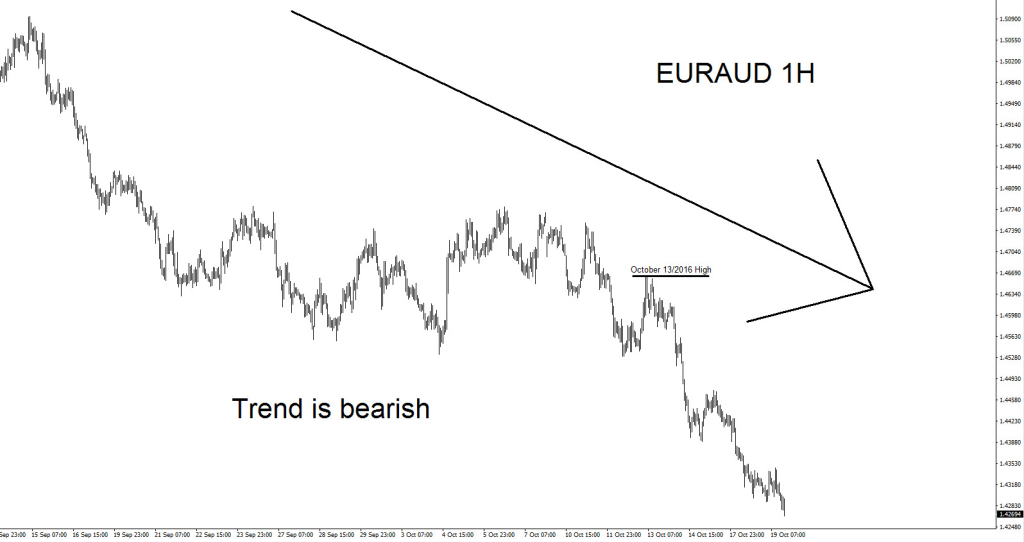
Before entering a trade it is always best for a trader to know which side the market is trending and continue buying or selling with the trend. In the case of EURAUD (Chart below) it was clear that the trend was bearish on October 13/2016 and traders should be only looking for selling opportunities.
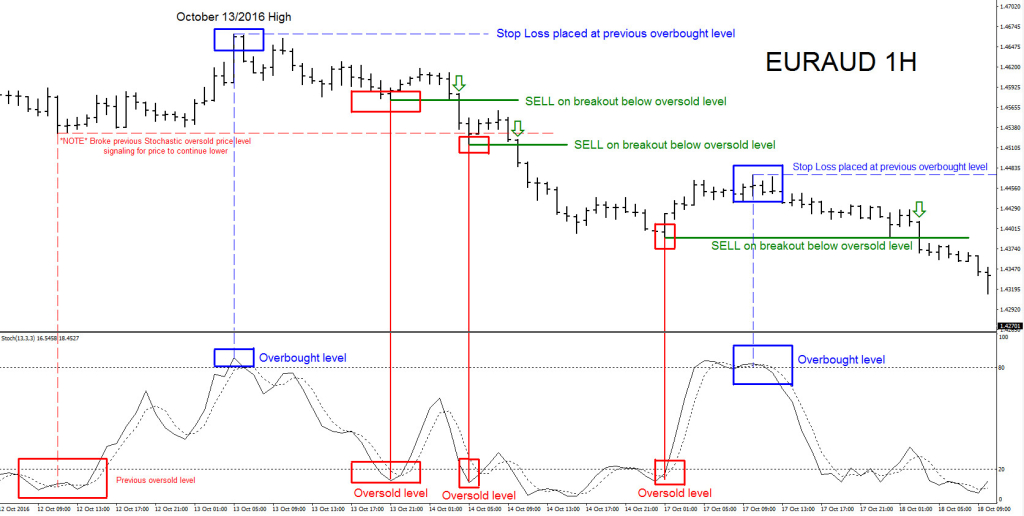
The chart below describes how a trader can enter the market waiting for momentum price action breakouts to occur. The Stochastic indicator is only used to determine certain price levels (Temporary bottoms and tops) where the trader enters the trade when price action breaks these levels. Once the Stochastic reaches an oversold level (below 20 level on Stochastic indicator) or an overbought level (above 80 level on Stochastic indicator) price should react with a bounce or rebound to determine a temporary bottom or top has formed. On October 13/2016 the EURAUD Elliott Wave count we provided to our members was calling lower. The overall trend of EURAUD was lower. So then should only look for sell breakouts lower.
EURAUD has pushed lower over 500 pips since October 13/2016. By following our Elliott Wave analysis and using the price action breakout technique above you too could have entered and caught the swing move lower. Of course, like any strategy/technique, there will be times when the strategy/technique fails so proper money/risk management should always be used on every trade. Hope you enjoyed this article and follow me on Twitter > @AidanFX if you have any questions 🙂
*** Always use proper risk/money management according to your account size ***
Subscribe !!! Become an EWF member and get access FREE to our Live Trading Room > Click and get access
At Elliottwave-Forecast we cover 52 instruments (Forex, Commodities, Indices) in 4 different timeframes and we offer 3 Live Session Webinars everyday. We do Daily Technical Videos, Elliott Wave Trade Setup Videos and we have a 24 Chat Room. Our clients are always in the loop for the next market move.
Try Elliottwave-Forecast for 14 days FREE !!! Just click here –> 14 day FREE trial
Back


