CADJPY Technical Analysis 4.3.2018
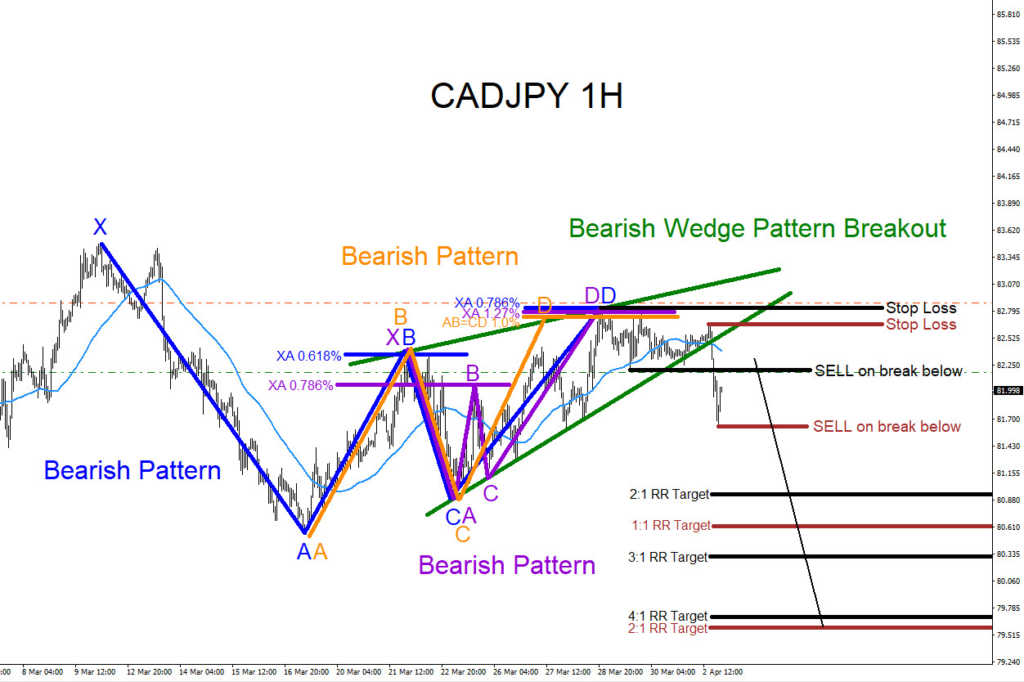
CADJPY has possibly formed a temporary top at the March 28/2018 high. As long as the pair stays below this high CADJPY can start another move lower below the March 19/2018 low. In the chart below, CADJPY is showing four bearish patterns that are clearly visible. Blue bearish pattern already triggered sells at the XA 0.786% Fib. retracement level, orange bearish pattern already triggered sells at the AB=CD 1.0% Fib. extension level and the purple bearish pattern has already triggered sells at the XA 1.27% Fib. retracement level. The pair has also broken below green bearish wedge pattern which the 1st SELL signal (Black) has already been triggered with stop loss at the blue point D high 82.82 level. Now a break below today’s low can trigger the 2nd SELL signal (Brown) and possibly extend the pair lower towards the March 19/2018 low. Stop loss for the 2nd entry should be placed at the 82.67 level. Traders should watch for the possible move lower and look to SELL CADJPY.
CADJPY 1 Hour Chart April 2/2018
Of course, like any strategy/technique, there will be times when the strategy/technique fails so proper money/risk management should always be used on every trade. Hope you enjoyed this article and follow me on Twitter for updates and questions> @AidanFX or chat me on Skype > EWF Aidan Chan
*** Always use proper risk/money management according to your account size ***
At Elliottwave-Forecast we cover 76 instruments (Forex, Commodities, Indices, Stocks and ETFs) in 4 different timeframes and we offer 5 Live Session Webinars everyday. We do Daily Technical Videos, Elliott Wave Trade Setup Videos and we have a 24 Chat Room. Our clients are always in the loop for the next market move.
Try Elliottwave-Forecast for 14 days FREE !!! Just click here –> 14 day FREE trial
Back

