AUDUSD Technical Analysis 10.30.2017
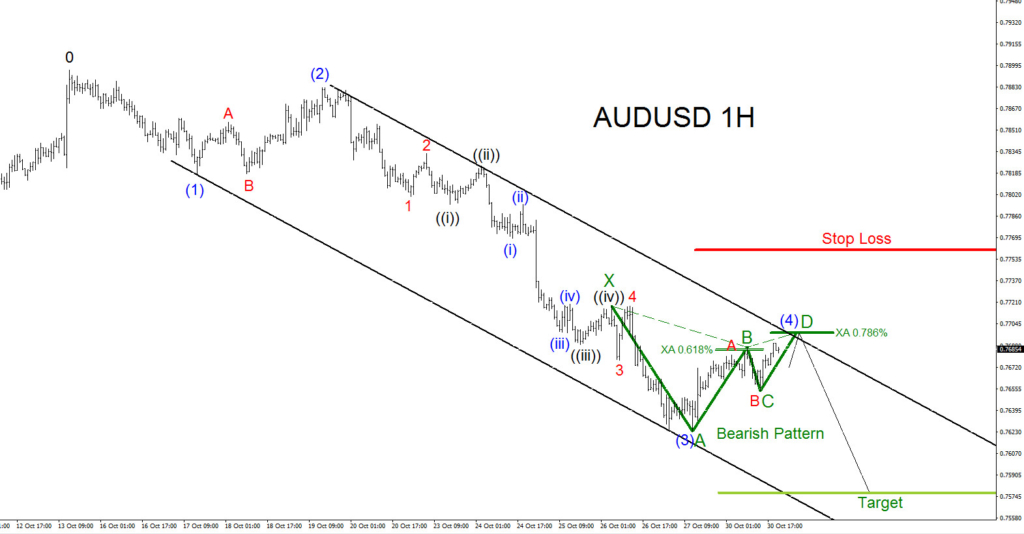
AUDUSD is currently in a Elliott Wave impulse five wave move lower from the October 13 high. The pair is currently in the blue wave (4) correction higher and traders should watch for the termination of this wave for another push lower towards the possible fifth wave target at 0.7580 area. There is also a green bearish Gartley pattern in the chart below that triggers sells at the XA 0.786% and together with the Elliott Wave count can be the area where wave (4) can possibly terminate. For now the green bearish Gartley pattern is just a possibility so stops should be placed higher at the 0.7760 level. Above the 0.7760 can extend price higher and invalidate the Elliot Wave count.
If looking to sell AUDUSD traders should be patient and wait for price to make a move higher above or at the XA 0.786% Fib. retracement level at 0.7698. Waiting for price to move above or at the XA 0.786% Fib. retracement level will offer a better risk/reward trade setup. Green bearish pattern is invalidated if price moves above point X high of the pattern.
Of course, like any strategy/technique, there will be times when the strategy/technique fails so proper money/risk management should always be used on every trade. Hope you enjoyed this article and follow me on Twitter for updates and questions> @AidanFX or chat me on Skype > EWF Aidan Chan
*** Always use proper risk/money management according to your account size ***
At Elliottwave-Forecast we cover 76 instruments (Forex, Commodities, Indices, Stocks & ETFs) in 4 different time frames and we offer 4 Live Session Webinars everyday. We do Daily Technical Videos, Elliott Wave Trade Setup Videos and we have a 24 Chat Room. Our clients are always in the loop for the next market move.
Try Elliottwave-Forecast for 14 days !!! Just click here –> 14 Day Trial
Back

