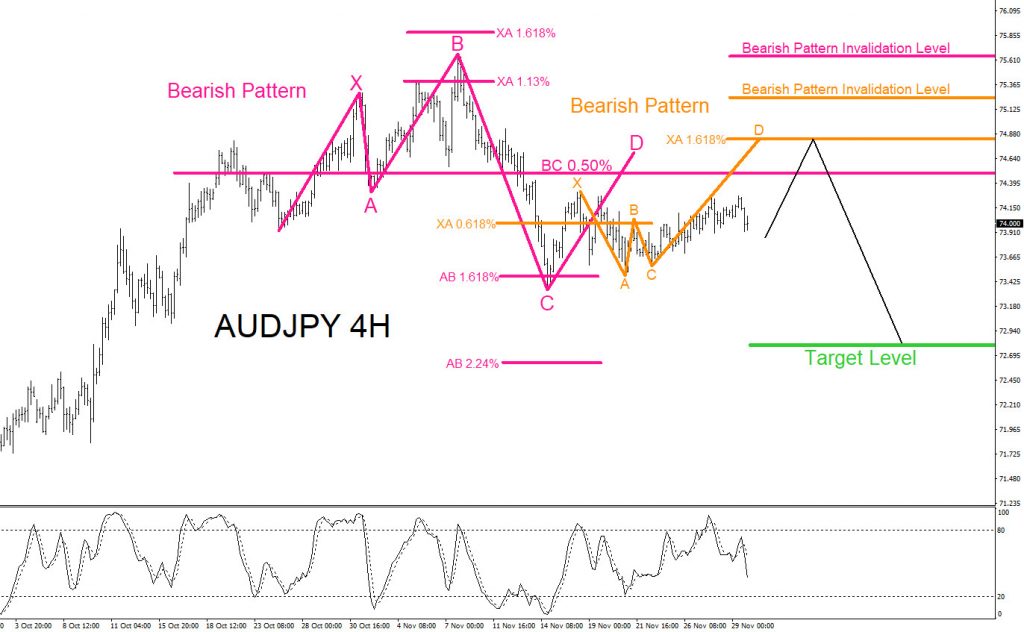
AUDJPY Technical Analysis December 1/2019
AUDJPY : Possible bearish patterns are visible on the 4 hour time frame. The pink bearish pattern still needs to make a push higher to complete point D at the BC 0.50% Fib. retracement level and the orange bearish pattern also needs to make a push higher to complete point D at the XA 1.618% Fib. level where AUDJPY can possibly reverse lower from. If price extends lower below the AB 2.24% Fib. level before reaching the BC 0.50% Fib. level then the pink bearish pattern is invalid and SELL setup is cancelled. If looking to trade AUDJPY traders should be patient and wait for price to make a move higher towards the minimum BC 0.50% Fib. retracement level. Waiting for price to hit the BC 0.50% Fib. retracement minimum will offer a better risk/reward trade setup. Pink bearish pattern is invalidated if price moves above point B of the pattern and orange bearish pattern is invalidated if price moves above 75.25 level. For now watch for signals above the BC 0.50% Fib level for selling opportunities.
AUDJPY 4 Hour Chart 12.1.2019
Of course, like any strategy/technique, there will be times when the strategy/technique fails so proper money/risk management should always be used on every trade. Hope you enjoyed this article and follow me on Twitter for updates and questions> @AidanFX or chat me on Skype > EWF Aidan Chan
*** Always use proper risk/money management according to your account size ***
At Elliottwave-Forecast we cover 78 instruments (Forex, Commodities, Indices, Stocks and ETFs) in 4 different timeframes and we offer 5 Live Session Webinars everyday. We do Daily Technical Videos, Elliott Wave Trade Setup Videos and we have a 24 Chat Room. Our clients are always in the loop for the next market move.
Try Elliottwave-Forecast for 14 days FREE !!! Just click here –> 14 day FREE trial
Back

