AUDCAD Technical Analysis April 30/2019
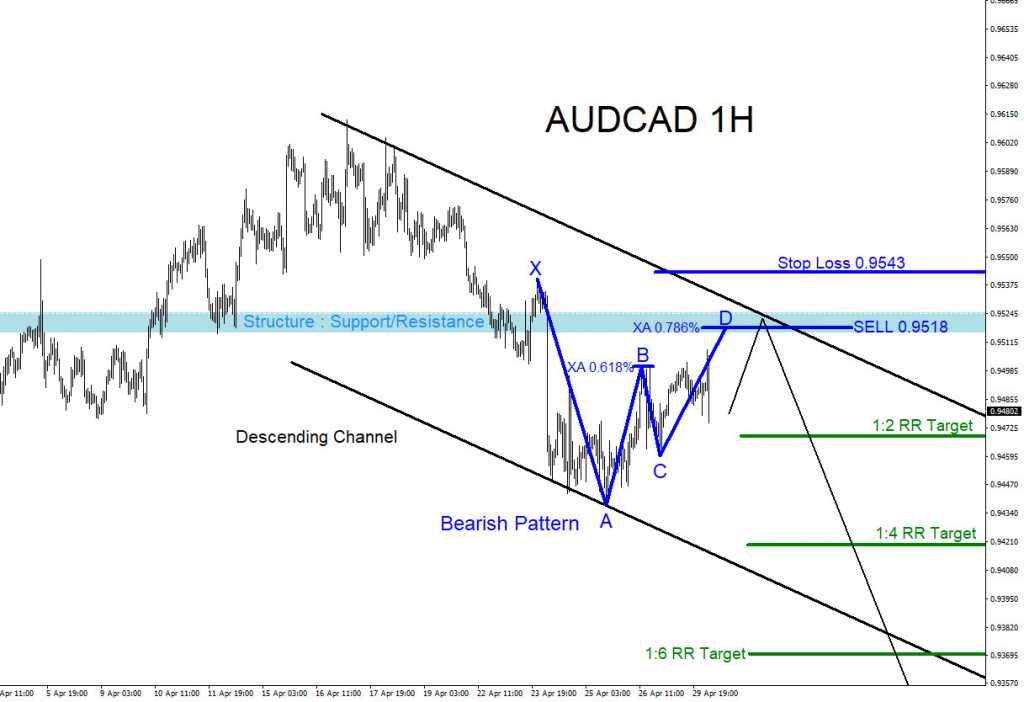
AUDCAD : A bearish market pattern is forming on the 1 hour chart but has yet to trigger entry. In the chart below the blue bearish pattern still needs to make a small push higher to tag the XA 0.786% Fib. retracement level where price can see a possible reversal lower. At the moment AUDCAD is trading below the XA 0.786% level and if we see a break below 0.9459 level then it is possible the blue bearish pattern will not trigger the SELL entry and the pair may continue lower. If looking to trade AUDCAD traders should watch for a move higher to the blue XA 0.786% Fib. level for the possible selling opportunity. SELL entry is at 0.9518 with stops at 0.9543 looking for price to move lower and hit the targets below (green). The stop loss is based on the invalidation of the blue bearish pattern but as long as the April 17/2019 high holds AUDCAD remains bearish. Only time will tell what AUDCAD will do but at least now you are aware of the possible area where the pair can reverse lower from.
AUDCAD 1 Hour Chart 4.30.2019
Of course, like any strategy/technique, there will be times when the strategy/technique fails so proper money/risk management should always be used on every trade. Hope you enjoyed this article and follow me on Twitter for updates and questions> @AidanFX or chat me on Skype > EWF Aidan Chan
*** Always use proper risk/money management according to your account size ***
At Elliottwave-Forecast we cover 78 instruments (Forex, Commodities, Indices, Stocks and ETFs) in 4 different timeframes and we offer 5 Live Session Webinars everyday. We do Daily Technical Videos, Elliott Wave Trade Setup Videos and we have a 24 Chat Room. Our clients are always in the loop for the next market move.
Try Elliottwave-Forecast for 14 days FREE !!! Just click here –> 14 day FREE trial
Back

