Hello traders. Let’s dive into the Wheat Elliott wave analysis, focusing on the bullish sequence that began in March 2024. We’ll revisit our traders’ last opportunity and explore the next one. Wheat (ZW_F) is one of the 78 instruments we analyze and share with members of www.elliottwave-forecast.com. This commodity belongs to group 2, alongside 25 others.
Wheat (ZW_F) completed the wave (II) supercycle pullback in March 2024. Since then, buyers have taken over, riding wave (III), which has just begun. Currently, we are in wave (3) of ((1)) of I of (III). Clearly, wave (III) has just started, implying a potential long-term bullish cycle for many years. While maintaining the long-term bullish trend, we focus on the current trend’s degree – wave (3) of the intermediate degree. Wheat is now in wave 5 of (3). Wave 4 ended on 17th May 2024 at 650’2. Before the subsequent surge, we shared the chart below with members.
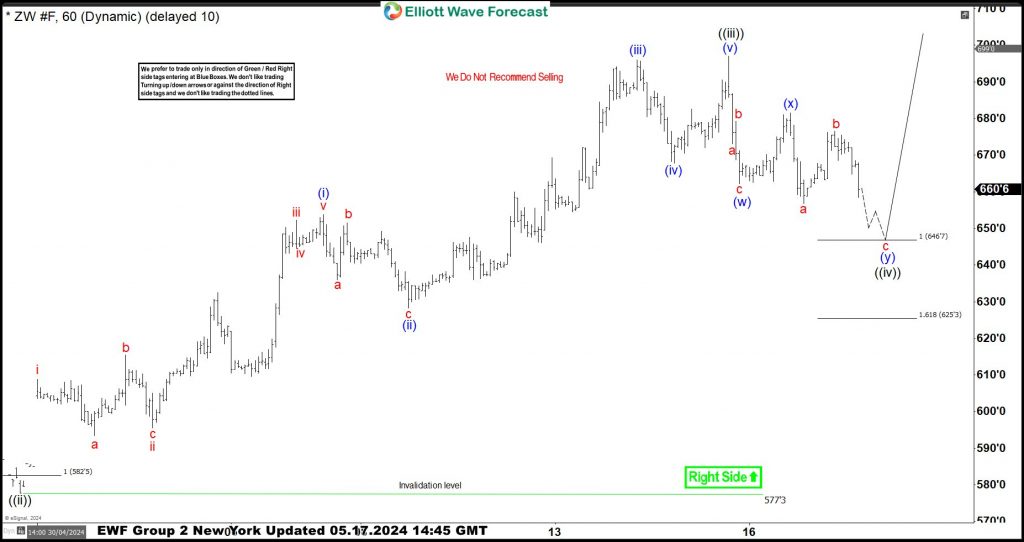
Wheat Elliott Wave Analysis – 05.17.2024
On 17th May 2024, we shared the chart above with members, identifying the pullback from 15th May completing a double zigzag structure. We also pinpointed the 646’7-625’3 zone as the extreme area where buyers should reenter. Thus, a LONG position from this zone with a stop loss below it should offer a good opportunity to join the dominant buyers. Our strategy involves identifying a clear price sequence – bullish or bearish – and then trading in that trend’s direction at a favorable price level. This is what we enjoy doing and sharing with members.
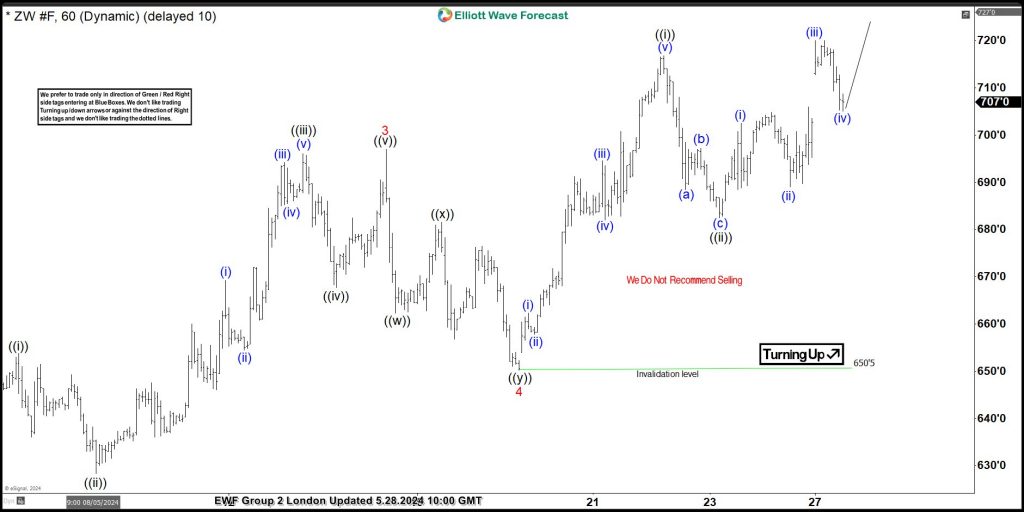
Wheat Elliott Wave Analysis – 05.28.2024
Fast forward to later in May 2024, Wheat progressed exactly from the zone, making a low of 650’5. The chart shared with members on 28th May 2024 shows how price action evolved since 17th May 2024. Despite the expected rally, we adjusted the count to fit the current price action. The dip is now wave 4 instead of wave ((iv)). However, the direction and idea remain the same.
What’s Next?
Wave 5 is currently in wave ((iii)). We aim to see wave 5 complete and buy the next pullbacks. As price action progresses, we will continue adjusting the count to fit. While doing so, we will wait for the best time to buy again, avoiding selling in an uptrend. This journey and that of the other 78 instruments we cover will be promptly shared with members. Members receive hourly updates four times a day and can use our forecasts as guides for their trading strategies. On each chart, we indicate the trading direction to consider. In the live trading room, members have access to trade signals and trade management guides. In addition, members can chat with our analysts 24 hours from Monday to Friday.
About Elliott Wave Forecast
www.elliottwave-forecast.com updates one-hour charts 4 times a day and 4-hour charts once a day for all our 78 instruments. We do a daily live session where we guide our clients on the right side of the market. In addition, we have a chat room where our moderators will help you with any questions you have about what is happening in the market.
Moreover, experience our service with a 14-day Trial for only $9.99. Cancel anytime by
Back


