In the past two years, Coca-Cola (NYSE: KO) has grappled with a challenging business landscape. Amid ongoing market uncertainty and volatility, investors closely examine the stock’s long-term growth prospects. In this article, we delve into analysing the current Elliott Wave Pattern for Coca-Cola, providing insights to guide investors through the stock’s mid-term movements.
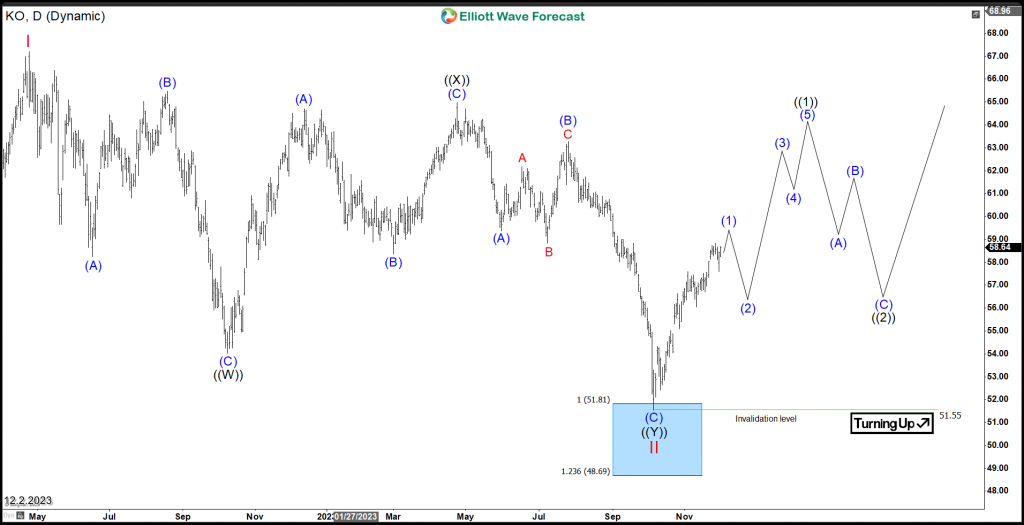
Since April 2022, KO has experienced a corrective phase, moving sideways to lower in wave II. It formed a double three Elliott wave structure with a 7-swing move to the downside. Notably, it reached its buying blue box area, which spans from $51.81 to $48.69. The blue boxes in our charts are the high-frequency areas where the market is likely to end cycles and make a turn.
Consequently, investors showed up strongly around that area and started buying the stock which created a strong impulsive reaction. The initial move is expected to be wave (1) of the first cycle wave ((1)) and therefore the next pullback in wave (2) is expected to remain supported above October low $51.55. Following this, we anticipate another rally completing waves (3)(4)(5) before concluding the cycle with wave ((1)). Subsequently, wave ((2)) is expected to bring a more substantial correction and the stock will be again looking to find support during that period of time.
Coca-Cola (NYSE: KO) Daily Chart 12.2.2023
In summary, Coca-Cola (NYSE: KO) is initiating a fresh bullish cycle based on the current impulsive structure. However, for a bullish sequence within the daily cycle and to prevent the possibility of another double correction, the stock requires a breakthrough above the 2022 peak.
Back


