Hello Traders in this article we will see how we were forecasting XAU/USD to make the next leg higher within wave ((v)).
Gold since it found support back from 09.28.2022 it has been in a bullish cycle. Since then it has been creating incomplete bullish sequences. Here at Elliott Wave Forecast we use incomplete sequences to trade the right side. This way we separate clear tradable sequences from choppy structures. By doing that we take the highest probability trade setups. With the USDX selling off since the 09.28.2022 peak Gold had to follow as everyone knows that mainly it is inversely correlated with it.
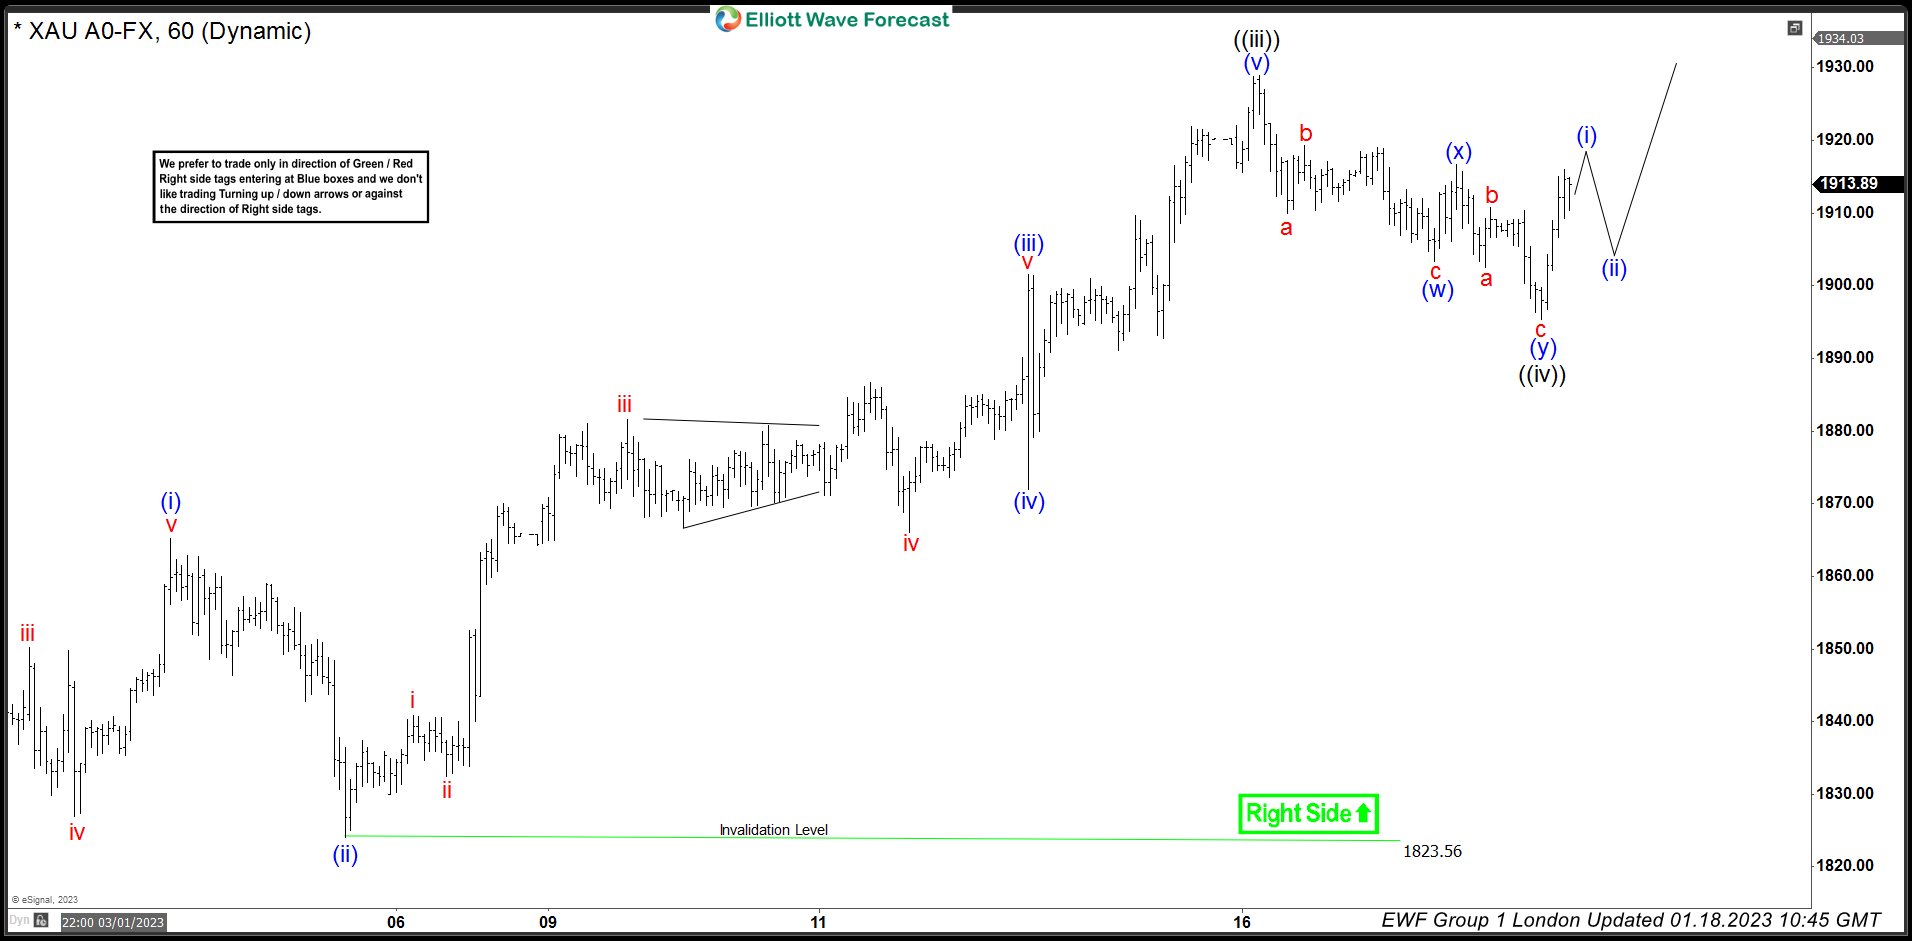
First let’s look at Gold when we saw the pullback in wave ((iv)).
XAU 1 Hour London Update 01.18.2023
As we can see Gold made the pullback in wave ((iv)). It made a double in a-b-c (w)-(x)-(y) lower to complete wave ((iv)). From there we were anticipating the next leg higher in ((v)) to start.
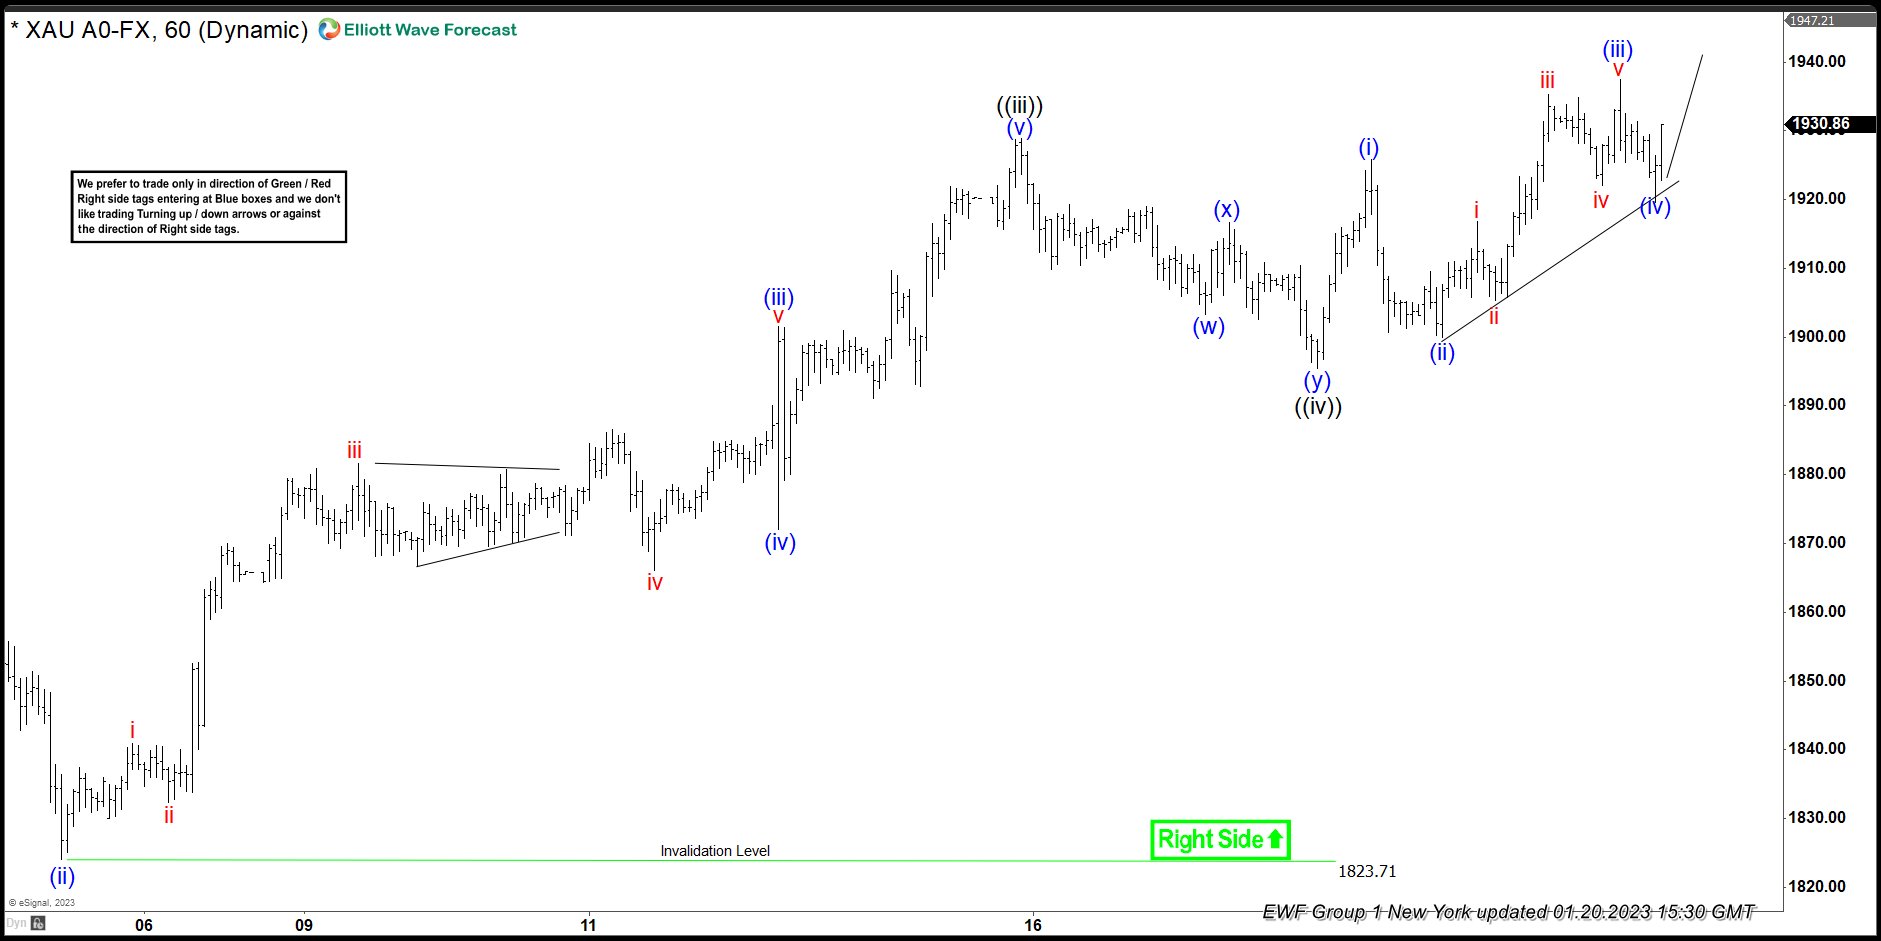
Then let’s see how it had developed next.
XAU 1 Hour New York Update 01.20.2023
As we can see XAU/USD made the push higher and completing the first 3 waves of wave ((v)) and now pulling back in (iv) of ((v)) with one more high expected to end the 5 waves move in the minor degree of ((v)).
All this will end just one leg of a larger degree cycle that started in Gold since September lows. To get daily updates for the short term and long term degree in Gold consider to join us today. Learn how to trade the right side. You will be able to attend or watch the recording of our daily Live Analysis sessions. Plus you can also join our daily Live Trading Room where we share trading setups with a defined entry, stop loss and take profit levels.
Join us today: Elliott Wave Forecast
50% off Planum & Diamond Plans: Flash Sale - Platinum and Diamond
Or for a 14 day trial: Elliott Wave Forecast Trial Plan Page


