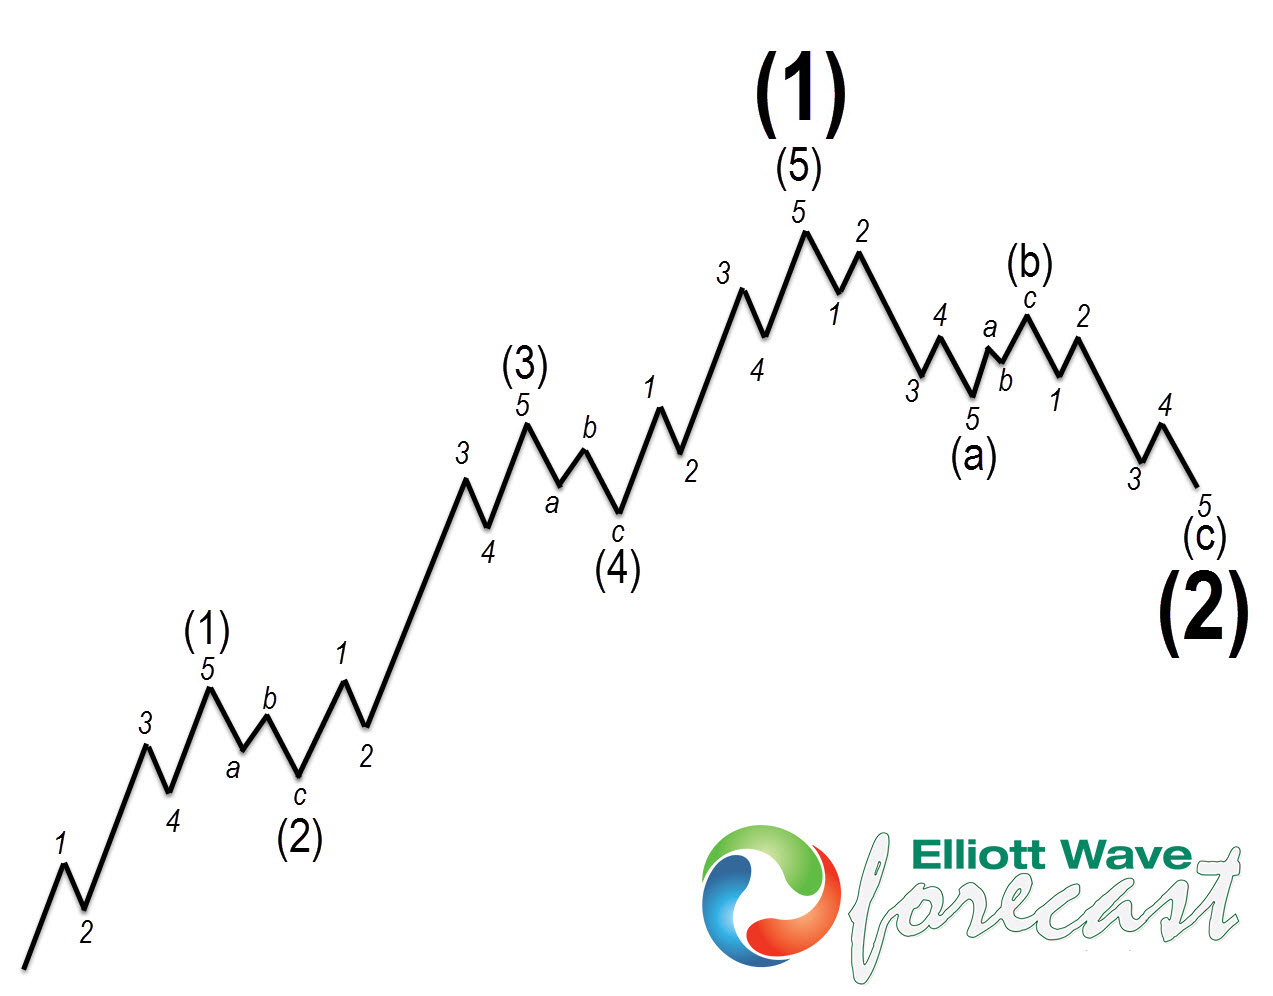
In today’s video blog we will look at a very interesting topic around the market which is the price of Crude Oil and how it could affect the price of Gasoline. We will start by taking a look at the famous Impulse Wave pattern in Elliott wave which is shown below
Elliott Wave Impulse Pattern
Graphic below shows Elliott wave impulse pattern. Impulse wave subdivide into 5 waves. Wave (1), (3) and (5) subdivisions are impulse. The subdivision in this case is 1,2,3,4,5. In an impulse wave, wave 2 can’t retrace more than the beginning of wave 1. Wave 3 can not be the shortest wave of the three impulse waves, namely wave 1, 3, and 5. Wave 4 does not overlap with the price territory of wave 1. Wave 5 needs to end with momentum divergence. After an impulse wave completes, there is a pull back to correct the impulse higher. This pull back is corrective and unfolds in 3, 7 or 11 swings and could take many different forms such as zigzag, double three, FLAT etc.
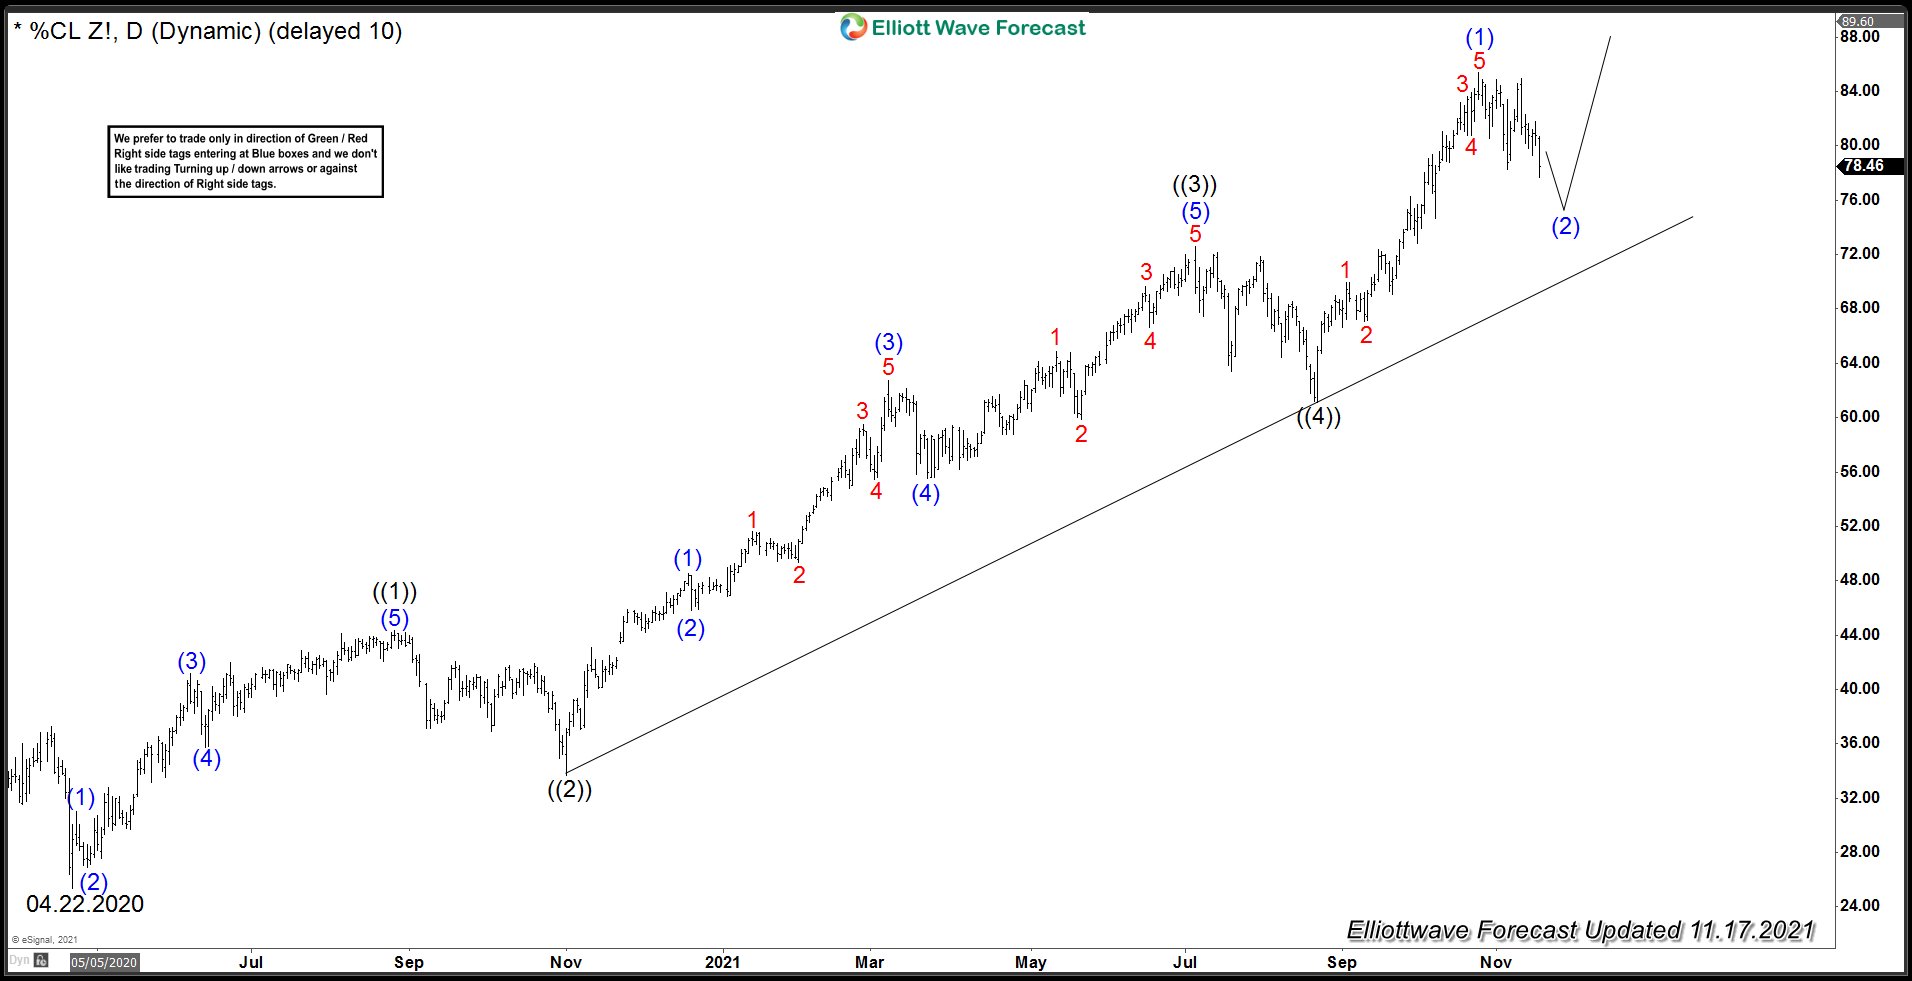
Crude Oil Elliott Wave Analysis – Cycle from April 2020
Chart below shows an Impulse Elliott wave pattern in Crude Oil which started back in April 2020. We can see wave ((1)) ended at $44.33, wave ((2)) ended at $33.64, wave ((3)) completed at $72.61, wave ((4)) completed at $61.11. Up from proposed wave ((4)) low, we have seen 5 waves up which we have labelled as wave (1) of ((5)). 5 waves up from April 2020 low means the trend in Oil remains higher against against April 2020 low and even when an extension in wave ((5)) is possible as far as price stays above wave ((4)) low, there is risk of a larger (A)-(B)-(C) correction to unfold to correct the entire rally from April 2020 low. Once larger pull back in Oil price starts, a relief in price of Gasoline should follow.
At Elliottwave-Forecast, we don’t like to pick tops and bottoms and always push the trend so as far as ((2))-((4)) trend line remains in place, we are calling for extension higher within wave ((5)) but we are telling clients that there are 5 waves up from April 2020 low and a warning of a huge pull back in Oil followed by drop in Gasoline prices based on it’s correlation with Oil and similar structure since April 2020 low (shown in the video below). If Oil breaks the low of proposed wave ((4)), that will confirm the end of impulse wave up from April 2020 low and a huge pull back will start.
As we mentioned earlier, that wave ((5)) needs to come with momentum divergence and we use RSI (Relative Strength Index) to check momentum divergence. If the extension higher in Oil erases RSI divergence, then wave ((3)) and ((4)) will become (1),(2) and structure will change from 5 waves impulse to a bullish best and we will see acceleration higher in wave (3) of ((3)). If Oil follows this path, then Gasoline prices should follow and there shouldn’t be relief in price of Gasoline.
Crude Oil and Gasoline Video Analysis
Back


