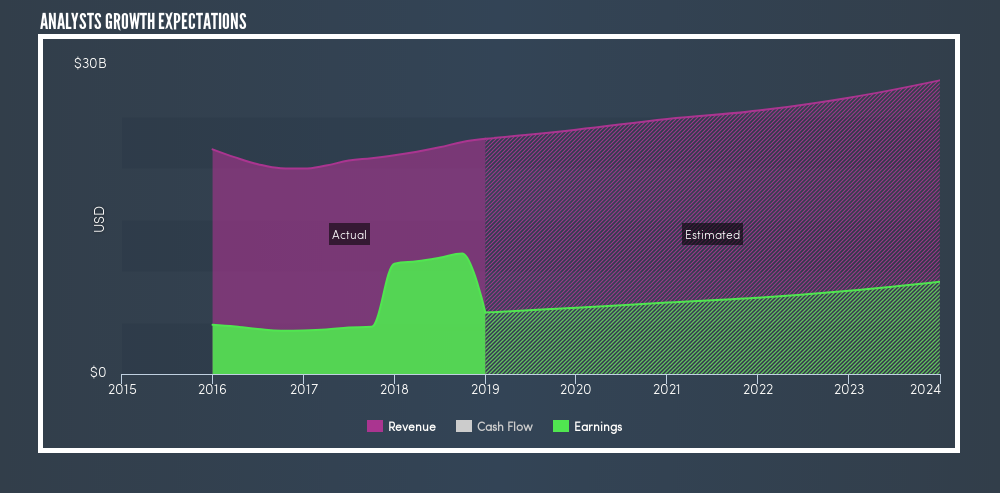
Union Pacific Railroad (NYSE:UNP) is a publicly-traded railroad holding company that was established in 1969. Last year, revenues grew to $22.8 billion, while earnings was up in mid-single-digits to $10.8 billion. Revenue growth was led by strong gains in Intermodal, amid capacity constraints in the trucking industry and a higher industrial production for commodities shipments.
Union Pacific’s year on year earnings growth rate has been positive over the past 5 years and it outperformed the Transportation industry. Its earnings are expected to grow by 7.1% yearly and revenue is expected to grow by 4% yearly.
UNP Future Revenue and Net Income Expectation
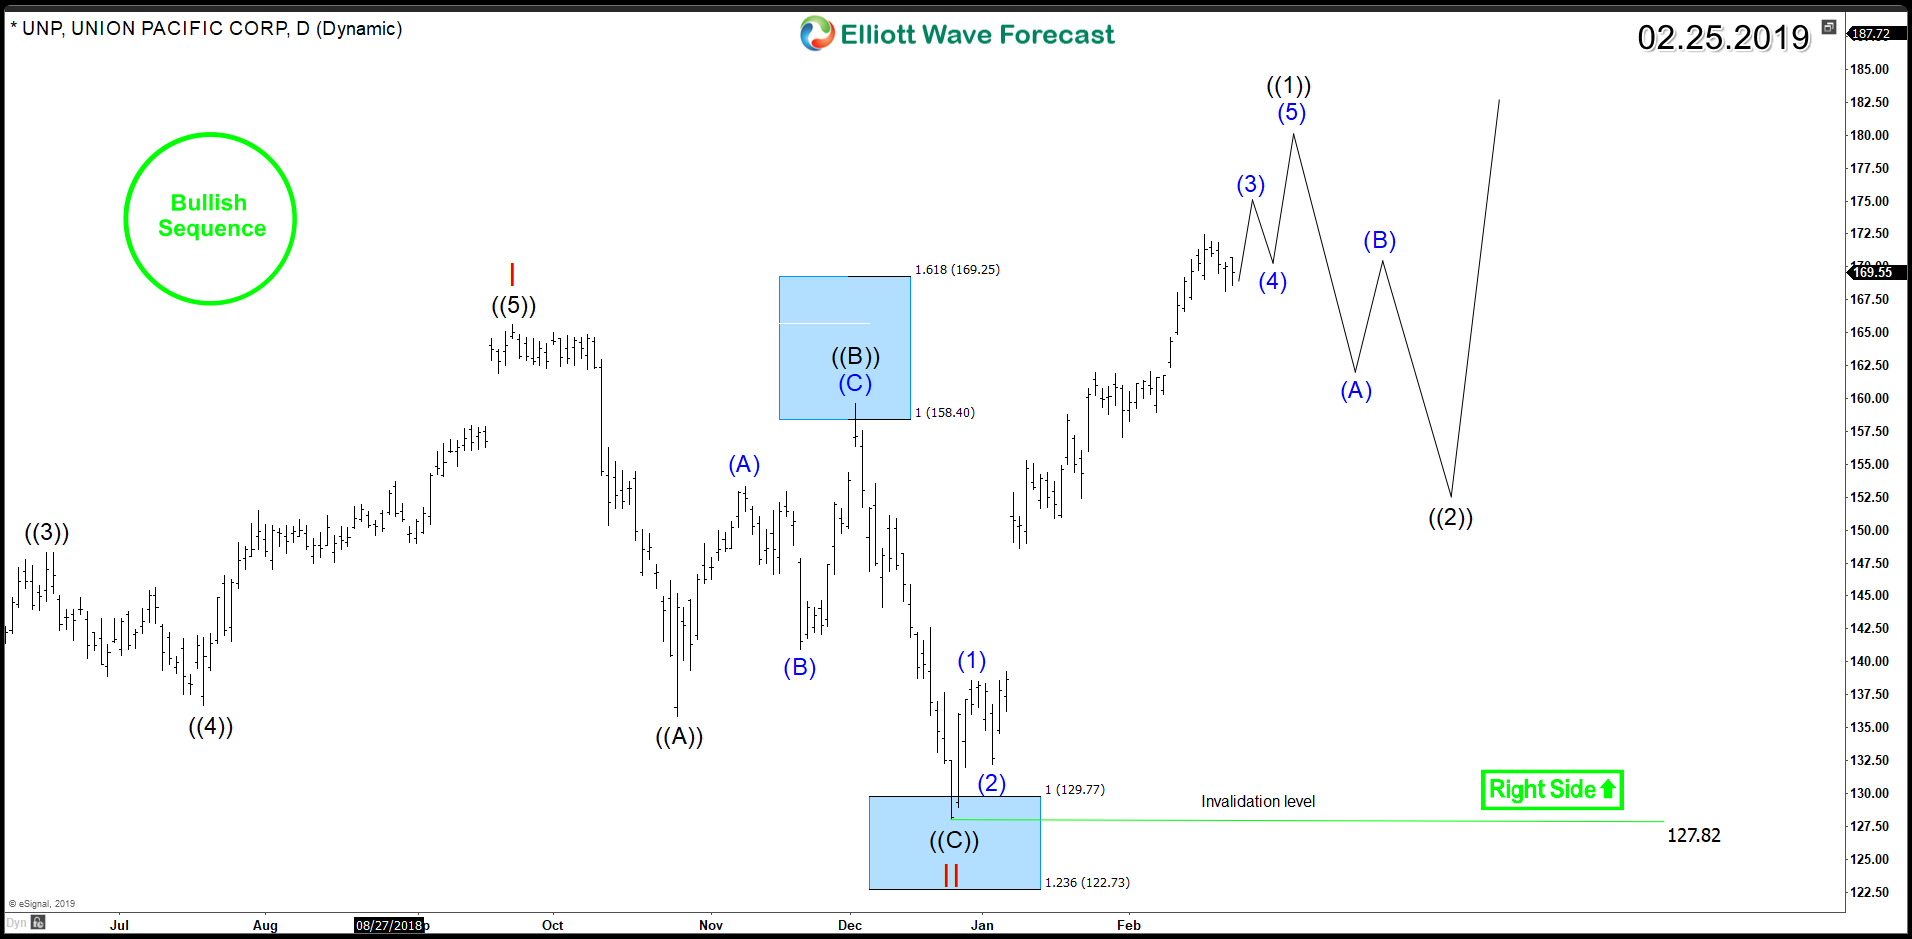
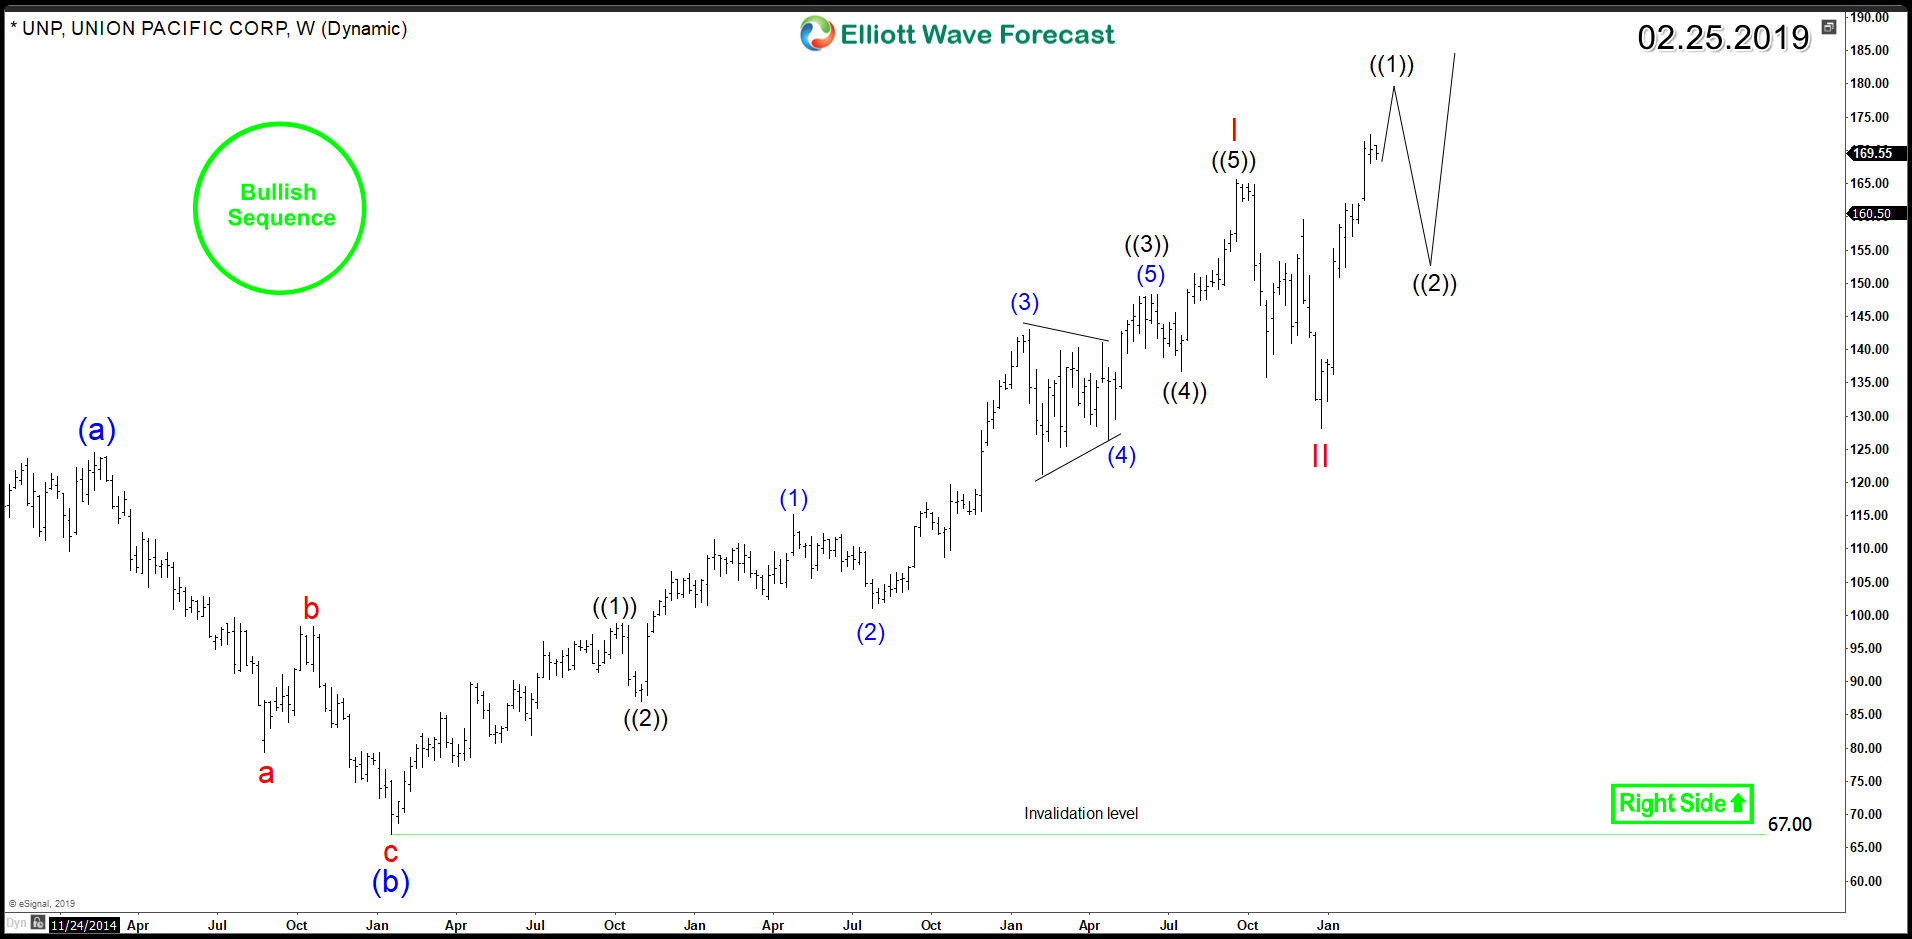
Moving on to the technical picture of the stock using weekly and daily Elliott wave chart :
From January 2016 low, UNP rallied higher in an impulsive 5 waves advance breaking 2015 peak which opened a new bigger cycle to the upside. The 5 waves rally ended as a wave I in September 2018 then did a 3 waves pullback Zigzag Structure in wave II which reacted higher from the blue box area $129 – $122.
Up from there, the stock resumed the rally breaking to new all time highs and opening a new bullish sequence to the upside calling for a move toward target area $226 – $287. Therefore, UNP pullbacks are expected to remain supported above December 2018 low $127 and find buyers in 3 , 7 or 11 swings.
UNP Elliott Wave Daily Chart
UNP Elliott Wave Weekly Chart
Conclusion
UNP bulls are looking to stay in charge as the stock has a bullish sequence from 2016 and 2018 lows so Investors may be looking ahead to the next couple of weeks for buying opportunities during the coming pullbacks.
Explore a variety of investing ideas by trying out our services 14 days and learning how to trade our blue boxes using the 3, 7 or 11 swings sequence. You will get access to our 78 instruments updated in 4 different time frames, Live Trading & Analysis Session done by our Expert Analysts every day, 24-hour chat room support and much more.
Back


