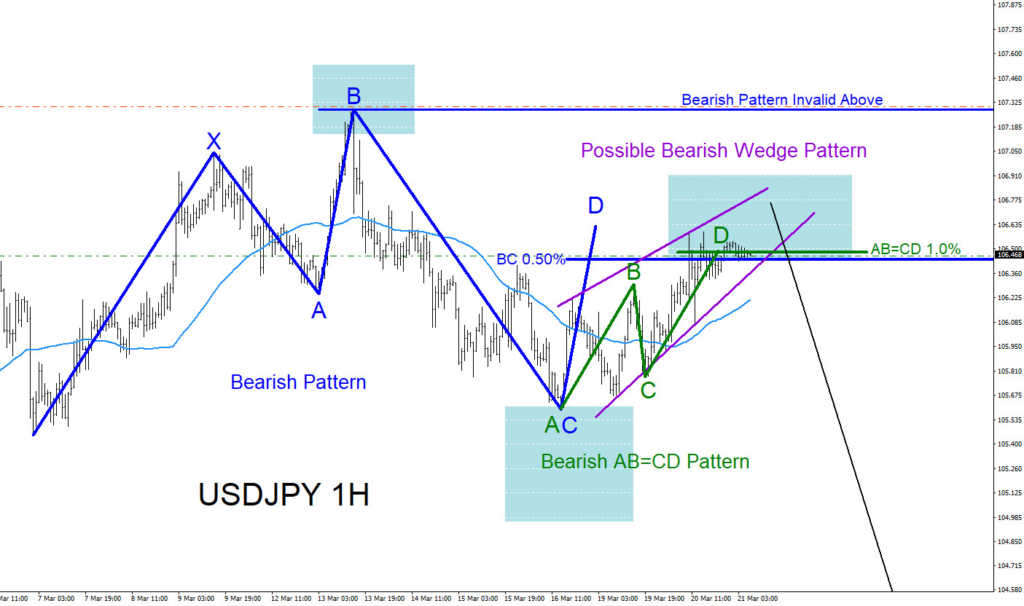
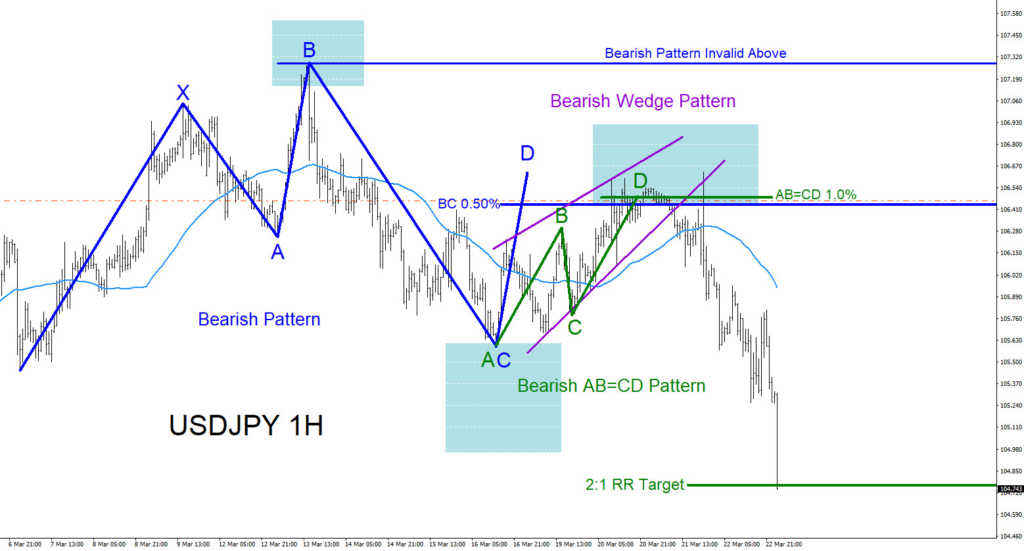
USDJPY 1 Hour Chart 3.21.2018
USDJPY was showing market patterns telling traders that the possiblity of the pair moving lower was coming. On March 21/2018 I posted the above USDJPY 1 hour chart trade setup on Twitter @AidanFX calling that the pair will make another move lower. Market patterns were clearly visible for bears to start entering USDJPY SELLS/SHORTS to reverse the correction higher and commence the dip lower. There were three bearish market patterns that all triggered SELLS in the same area. Blue bearish pattern triggered SELLS at the BC 0.50% Fib. retracement level. Green bearish pattern triggered SELLS at the AB=CD 1.0% Fib. extension level and the purple bearish pattern was waiting for a break below the bottom trend line of the wedge pattern. Any selling should have been at the proposed blue box area with stop loss at the blue bearish pattern invalidation level at the blue point B high. The chart below shows USDJPY reacting with the move lower hitting the 2:1 RR target where traders took profits. Most of the time the markets will give traders clear signals on which side to trade. Traders just need to be patient and watch for the trade setups to form.
Of course, like any strategy/technique, there will be times when the strategy/technique fails so proper money/risk management should always be used on every trade. Hope you enjoyed this article and follow me on Twitter for updates and questions> @AidanFX or chat me on Skype > EWF Aidan Chan
*** Always use proper risk/money management according to your account size ***
At Elliottwave-Forecast we cover 76 instruments (Forex, Commodities, Indices, Stocks and ETFs) in 4 different timeframes and we offer 5 Live Session Webinars everyday. We do Daily Technical Videos, Elliott Wave Trade Setup Videos and we have a 24 Chat Room. Our clients are always in the loop for the next market move.
Try Elliottwave-Forecast for 14 days FREE !!! Just click here –> 14 day FREE trial
Back


