GBPJPY
Elliott Wave pattern, Harmonic pattern, Head and Shoulder pattern, Channel pattern, Wedge pattern, Triangle pattern, Cup and Handle pattern, W. Wave pattern, Double and Triple Bottom/Top patterns, Pennant pattern, Flag pattern are all market patterns that every trader sees everyday on every time frame. These market patterns all have precise trading entry levels and invalidation levels/stop loss levels. GBPJPY on the 1 hour chart produced two market pattern breakouts towards the end of February 2018 signalling bears/sellers that the pair was going to extend and make newer lows.
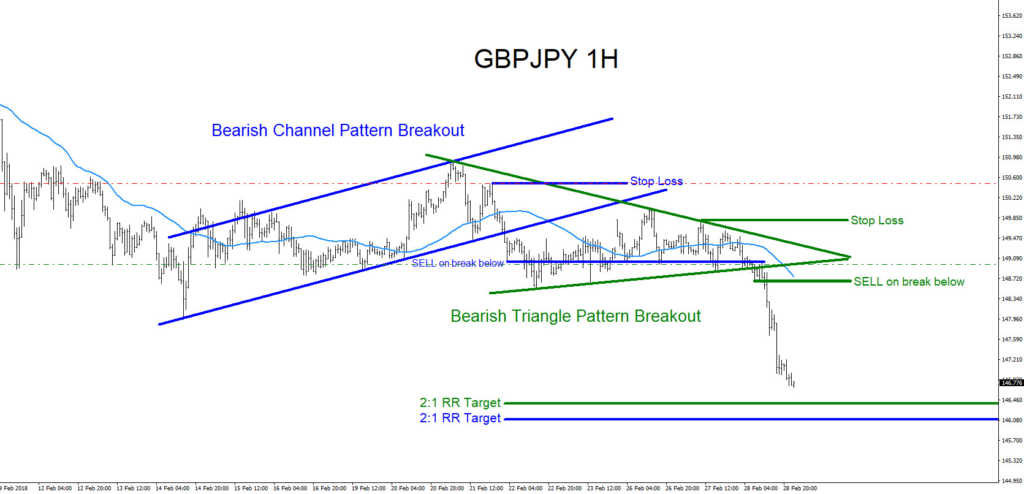
GBPJPY 1 Hour Chart (Two Bearish Patterns) The chart below clearly shows two market pattern breakouts. A Bearish Channel Pattern (Blue) and a Bearish Triangle Pattern (Green). On February 22/2018 price broke out of the blue bearish Channel pattern triggering sells at the 149.02 level calling that momentum has now possibly changed to the downside. The pair broke lower but then bounced and corrected higher but the movement higher did not have enough momentum to continue higher which then eventually formed the green bearish Triangle pattern. On February 28/2018 price broke below the green bearish Triangle and triggered sells at the 148.67 level and bears pushed the pair lower to newer lows. Both blue and green market patterns had precise entries and each had precise stop loss levels to invalidate the pattern. Any trader that was watching GBPJPY could have traded either one of these market patterns and would have banked over +250 pips hitting the 2:1 RR targets.
Market Pattern Breakouts with an Elliott Wave forecast combined is a great trading strategy. As you will see below the Elliott Wave count we provided to our clients showed that GBPJPY was going to move lower.
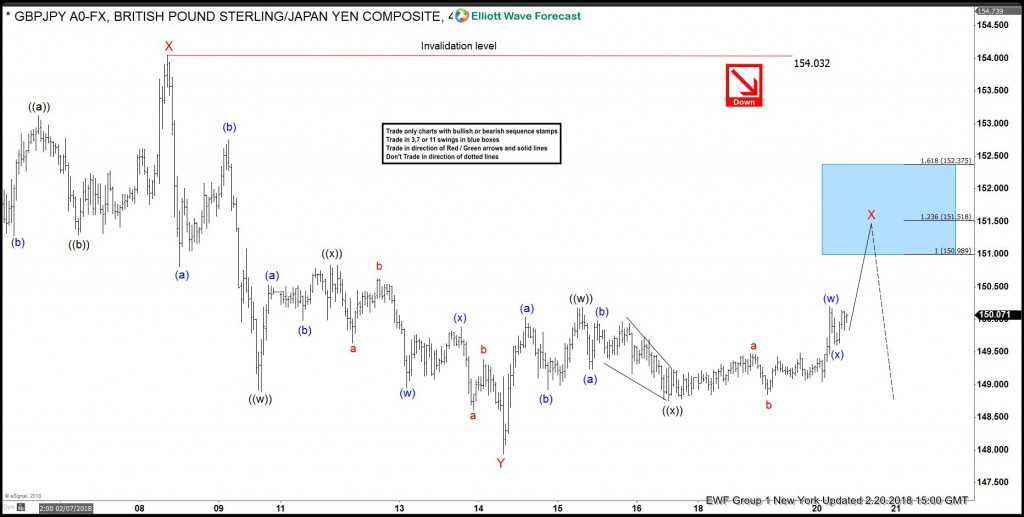
GBPJPY 1 Hour Chart February 20/2018 (New York Update) On February 20/2018 we advised clients that the pair will reverse lower after the next push higher towards the blue box area. After the reversal lower, all you as a trader had to do was wait for the blue Channel breakout lower to enter SELLS.
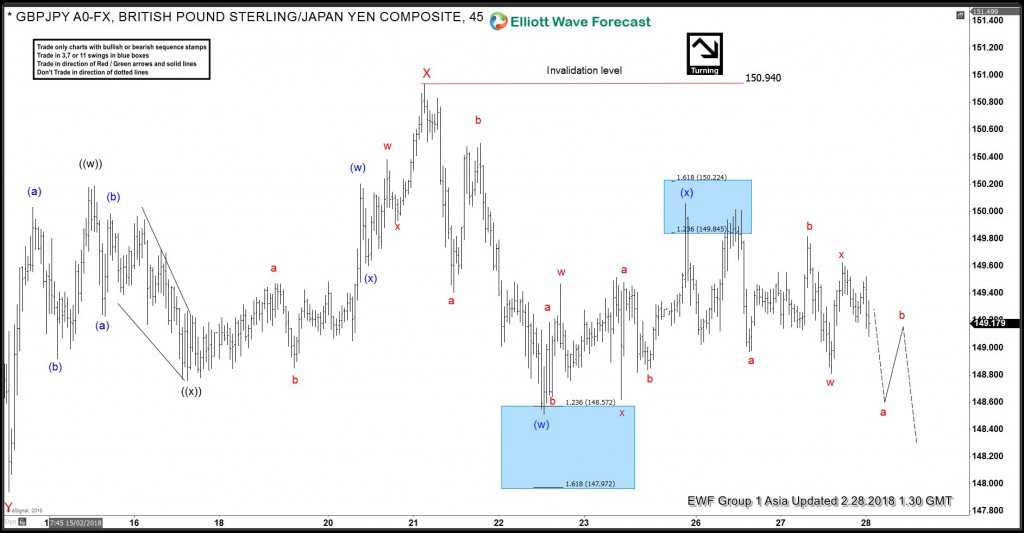
GBPJPY 1 Hour Chart February 28/2018 (Asia Update) On February 28/2018 we advised clients that the pair will continue lower. All you as a trader had to do was wait for the green Triangle breakout lower to enter SELLS.
Of course, like any strategy/technique, there will be times when the strategy/technique fails so proper money/risk management should always be used on every trade. Hope you enjoyed this article and follow me on Twitter for updates and questions> @AidanFX or chat me on Skype > EWF Aidan Chan
*** Always use proper risk/money management according to your account size ***
At Elliottwave-Forecast we cover 76 instruments (Forex, Commodities, Indices, Stocks and ETFs) in 4 different timeframes and we offer 5 Live Session Webinars everyday. We do Daily Technical Videos, Elliott Wave Trade Setup Videos and we have a 24 Chat Room. Our clients are always in the loop for the next market move.
Try Elliottwave-Forecast for 14 days FREE !!! Just click here –> 14 day FREE trial
Back


