AUDJPY Technical Analysis 10.27.2017
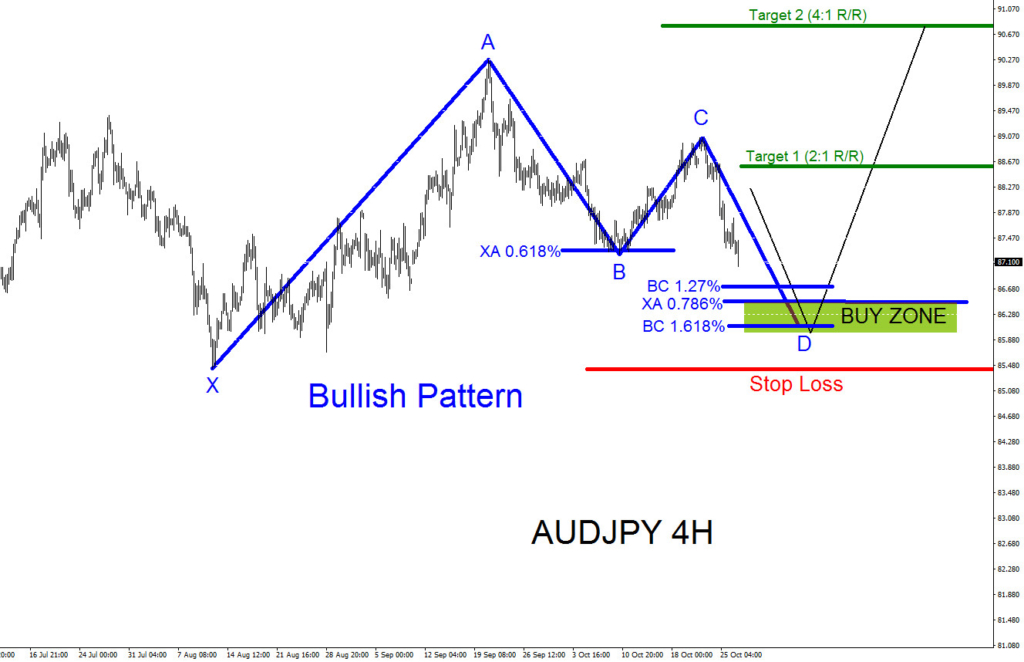
AUDJPY has been trending to the upside making higher highs and higher lows since June 24/2016 on the Daily chart. On the 4 hour (Chart below) we can see a possible bullish pattern that can extend the trend higher and push AUDJPY to new highs. The chart below we can see clearly a bullish Gartley pattern where the BUY triggers at the XA 0.786% Fib. retracement. The zone to watch for the possible bounce higher is 86.46 – 85.96 and the invalidation level of the bullish Gartley pattern is at the point X low at 85.42.
AUDJPY 4 hour chart 10.27.2017
If looking to buy AUDJPY traders should be patient and wait for price to make a move lower below or at the XA 0.786% Fib. retracement level at 86.46. Waiting for price to move below or at the XA 0.786% Fib. retracement level will offer a better risk/reward trade setup. Blue bullish pattern is invalidated if price moves below point X low of the pattern and stops should be placed at this level.
Of course, like any strategy/technique, there will be times when the strategy/technique fails so proper money/risk management should always be used on every trade. Hope you enjoyed this article and follow me on Twitter for updates and questions> @AidanFX or chat me on Skype > EWF Aidan Chan
*** Always use proper risk/money management according to your account size ***
At Elliottwave-Forecast we cover 76 instruments (Forex, Commodities, Indices, Stocks & ETFs) in 4 different time frames and we offer 4 Live Session Webinars everyday. We do Daily Technical Videos, Elliott Wave Trade Setup Videos and we have a 24 Chat Room. Our clients are always in the loop for the next market move.
Try Elliottwave-Forecast for 14 days !!! Just click here –> 14 Day Trial
Back

