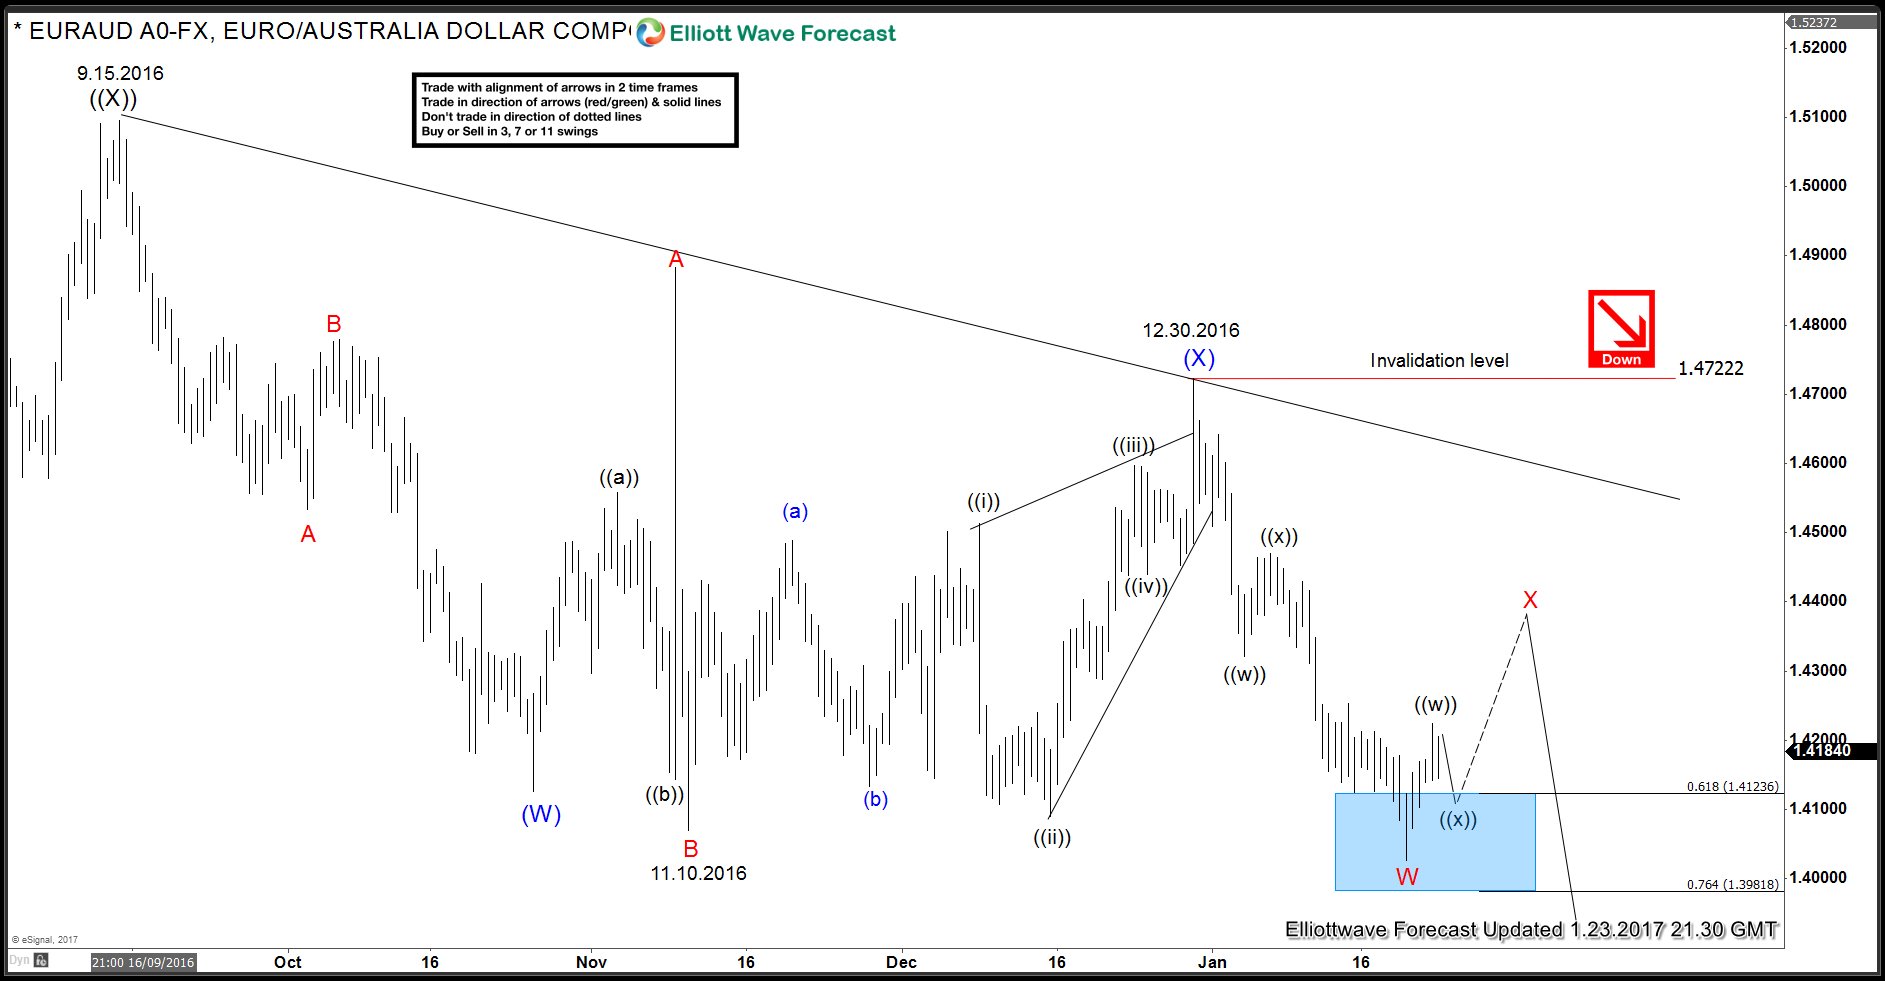
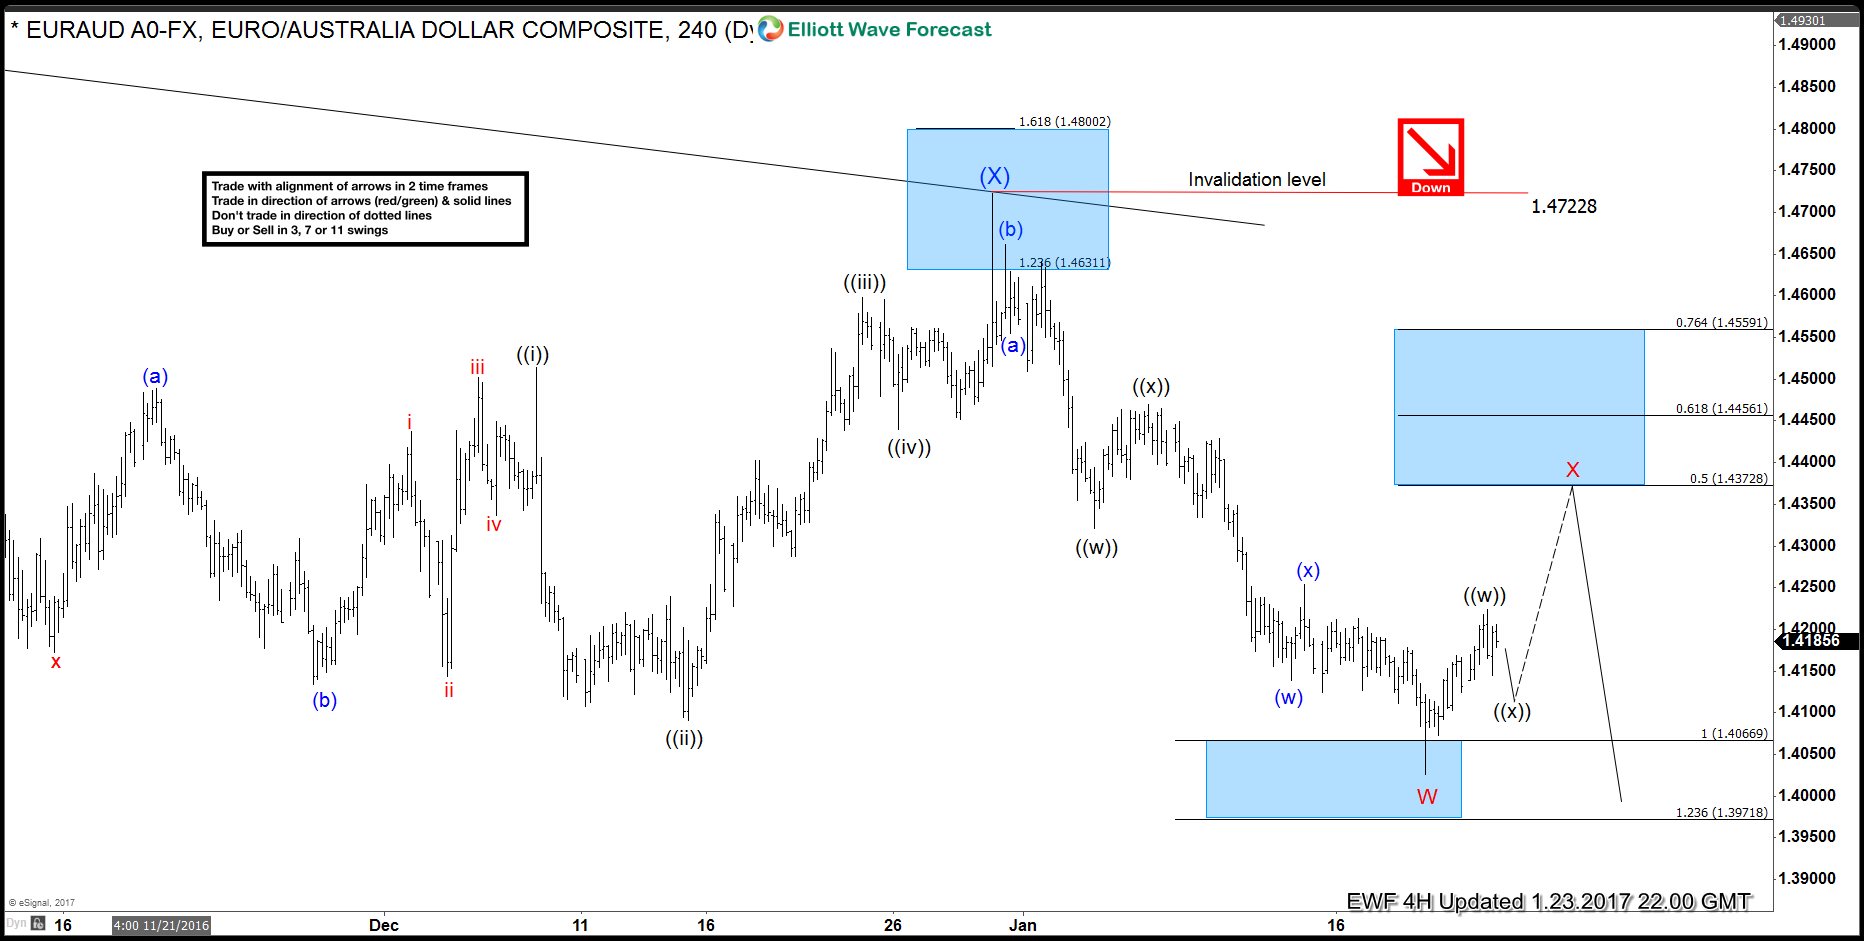
EURAUD has been in a steady downtrend since forming a peak on 8/24/2015 (1.6585). Although, pair is very close to 100% Fibonacci extension down from 8/24/2015 peak, Elliott wave sequence to the downside is incomplete and is calling for rallies to prove corrective and result in more downside in the pair. Last week, pair broke below 11/10/2016 low and dropped to the lowest level since May 2015 before it started bouncing. With the break of 11/10/2016 (1.4070) low, pair is showing 5 swings down from 9/15/2016 peak, 5 swings is an incomplete sequence and make the pair bearish against 12/30/2016 (1.4722) peak.
EURAUD 720 minute Chart
EURUSD decline from black ((X)) peak can be viewed as a zig-zag and completed wave (W) at 1.4126 (10/26/2016). After that, pair did a running FLAT wave (X) to 1.4722 which completed on 12/30/2016. Within this running FLAT wave (X), 3 waves rally to 1.4883 was wave A, 3 waves drop to 1.4070 was wave B and 5 swing move to 1.4722 was wave C as a diagonal. Since then pair has already made a new low below the red B which makes it 5 swings down from 9/15/2016 peak. This confirms the view that wave (X) completed at 1.4722 and wave (Y) lower is now in progress. The bounce last week came from the blue box between 1.4123 – 1.3981 which is nothing more than 0.618 – 0.764 Fibonacci extension area of (W)-(X) and is the typical area for 1st leg of wave (Y) to complete.
EURAUD 240 minute chart
As pair is showing 5 swings down from black ((X)) peak, we expect wave X bounce to hold below blue (X) peak for continuation lower towards 1.3752 – 1.3523 area which is 100 – 123.6 Fibonacci extension area of (W)-(X). We don’t like buying the area and expect wave X to find sellers in 3, 7 or 11 swings as far as pivot at blue (X) peak at 1.4722 high remains intact. Only a break of the down trend line and more importantly the pivot at blue (X) peak @ 1.4722 would negate the next extension lower.
At Elliottwave-Forecast, we offer 24 hour coverage of 52 instruments from Monday – Friday using Elliott Wave Theory as primary tools of analysis. We provide Elliott Wave chart in 4 different time frames, up to 4 times a day update in 1 hour chart, two live sessions by our expert analysts, 24 hour chat room moderated by our expert analysts, market overview, and much more! With our expert team at your side to provide you with all the timely and accurate analysis, you will never be left in the dark and you can concentrate more on the actual trading and making profits. Check out our 14 day Trial to sample everything we have to offer.
Back


