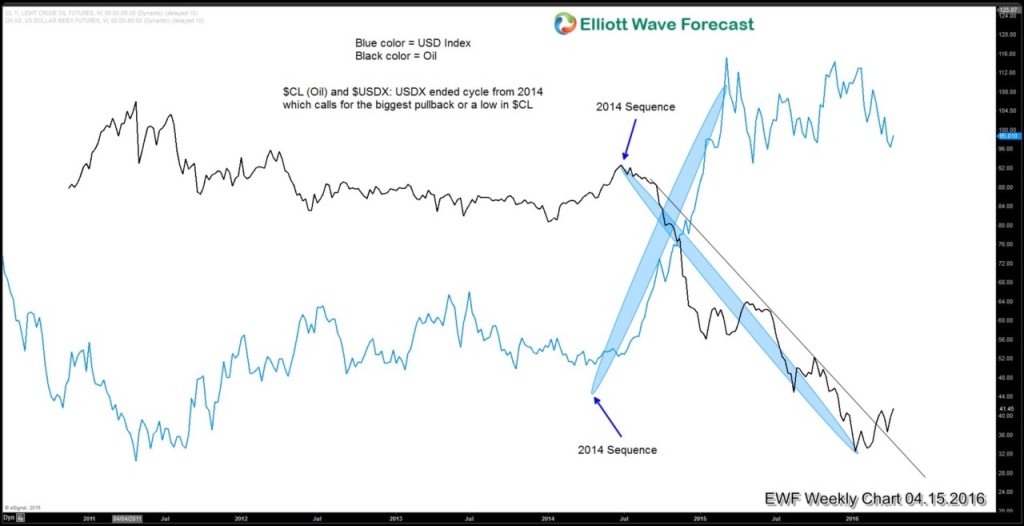
In our article dated Dec 13, 2015 titled “What OPEC decision means to Oil and $USDCAD” we wrote about the oil revolution; the rise of shale oil producers from North America and the OPEC cartel trying to fight against this threat by flooding the market with conventional oil to fight for market share and also drive out the higher-cost shale rivals. This strategy by OPEC has created an over-supplied condition in the oil market and has caused oil price to plunge 60% in just a little more than a year from $100 in the middle of 2014 to $40 in December 2015. We said in the December article that as long as there’s no end in sight in this price war, oil is going to continue to slide until OPEC has no choice other than to take action to reduce the glut.
In December 4, 2015 OPEC annual meeting, speculation started to emerge that OPEC members might attempt to cap production volume to prevent further price slide. Smaller OPEC member such as Venezuela has voiced concern over the oil price and wanted the cartel to take action to stabilize the market. However, with Iran soon to be free from the oil embargo at the time of the meeting, Saudi Arabia as the biggest oil producer in OPEC wanted to wait and see and unwilling to make a move. The failure to reach an agreement caused oil price to spiral down further from the already low price of $41 in December 2015 to just $28 in early February 2016 before the bleeding finally stopped.
The catalyst for the bounce came from a meeting in February 16 in which Saudi Arabia, Russia, and several key OPEC members agreed to freeze oil output production at the January level, if other suppliers follow suit. This news is what the market wants to hear, and oil has continued to recover from $28 low in February and now back to $42 in April (50% increase). There will be another summit this coming Sunday April 17 at Doha to secure commitment from a wider range of countries both inside and outside the OPEC cartel to freeze output production.
Oil analysts are skeptical that freezing output production at the January level will solve the oil glut for several reasons. First of all, freezing production output at January level means it is just maintaining the existing high production output, instead of reducing the production volume. Secondly, country like Iran whose economic sanction is recently lifted has also indicated they would not join the freeze and intend to raise production output from 3.1 million barrels to 4 million barrels a day. Last but not least, even if agreement to freeze production output can be reached from a wider range of producers and oil rally extends, this will encourage new supply from the US shale drillers and give pressure back to oil price.
Despite the limited impact of the production freeze to reduce the global supply glut, oil price still reacted positively due to the overextended selloff. At minimum, the summit is a positive sign as it demonstrates that oil participants are no longer indifferent about what happen in the market. If participants can come out from the summit this Sunday with a broader agreement to freeze output or some other measures, oil rally may continue. However, if the meeting falls apart, then oil could retrace back the rally from the February low.
Technical Analysis
Similar to USD Index, Oil completed the cycle from 2014 peak and it is currently doing the biggest correction if not already formed the weekly low. As shown in the chart above, Oil has broken above the 2014 weekly trend line channel and it has also made a sequence of higher high. Thus, regardless what the outcome of the Doha meeting is, the path of least resistance for Oil is to the upside. Even if the meeting does not produce good result and oil is pulling back, it is likely still to get support from the broken weekly channel
If you enjoy this article, you are welcome to read other technical articles at our Technical Blogs and check Chart of The Day. For further information on how to find levels to trade Oil, Gold, or other commodities, indices, and forex using Elliottwave, take our FREE 14 Day Trial. We provide Elliott Wave chart in 4 different time frames, up to 4 times a day update in 1 hour chart, two live sessions by our expert analysts, 24 hour chat room moderated by our expert analysts, market overview, and much more! With our expert team at your side to provide you with all the timely and accurate analysis, you will never be left in the dark and you can concentrate more on the actual trading and making profits.
Back


