Correlation between Oil and $USDCAD
One of the biggest trades in 2014 – 2015 is undeniably Oil and the correlated commodity currency Canadian dollar, or sometimes called Loonie. For some reasons, most Americans typically associate big crude oil exporters with Persian Gulf countries like Iraq, Kuwait, or Saudi Arabia. However, in reality, majority of crude oil consumed in the United States comes from Canada.
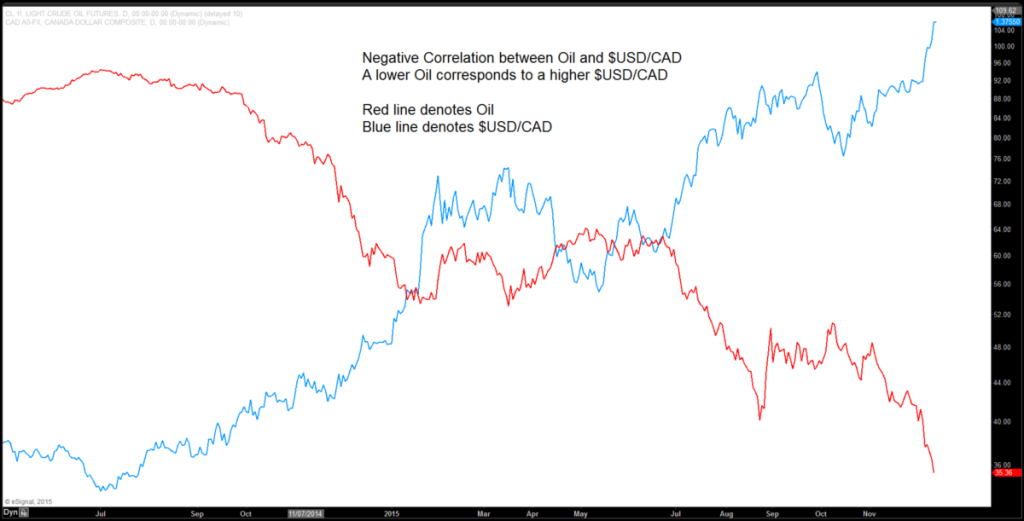
According to U.S Energy Information Association (EIA), in 2014 the U.S. consumed 2.9 million barrels of oil per day from Canada, compared to the second biggest supplier the Persian Gulf at 1.8 million barrels per day. For Canada, Oil is the single biggest export category at 27%, compared to the second largest export category Automotive at 12.6%. Given how significant Oil is to Canada’s economy, it’s not surprising to see negative correlation between Oil and $USDCAD as shown from the chart below:
Understanding the Fundamental Dynamics of Oil
OPEC, an oil cartel made up of 13 oil-producing nations, has been known in the past to have a considerable influence in the Oil market. Today, they collectively supply about one third of the global oil. The oil cartel often influences the global oil market by adjusting the production volume, i.e. cutting production volume when oil price drops.
However, over the past decade, North American upstarts producing unconventional oil sources called shale oil started to gain market share and threatened OPEC’s dominance in the Oil industry. Shale oil, as distinguished to the conventional crude oil, typically has a higher cost of production. OPEC, led by Saudi Arabia, decided to go into price war with the US shale producers since 2014 and kept the oil production output constant despite the evidence of a surplus in the market. Consequently, oil prices started to drop due to the oversupply, and OPEC hopes to drive out the younger and higher cost opponents.
The price war has been going on for 17 months now and in the last OPEC meeting in Vienna in early December 2015, they still decided to go with the price war and scrap production limits. With no end in sight in the oversupplied condition and brutal price war, Oil responded swiftly and dropped to the lowest level since 2008. $USDCAD followed along and also broke to the highest level since 2008.
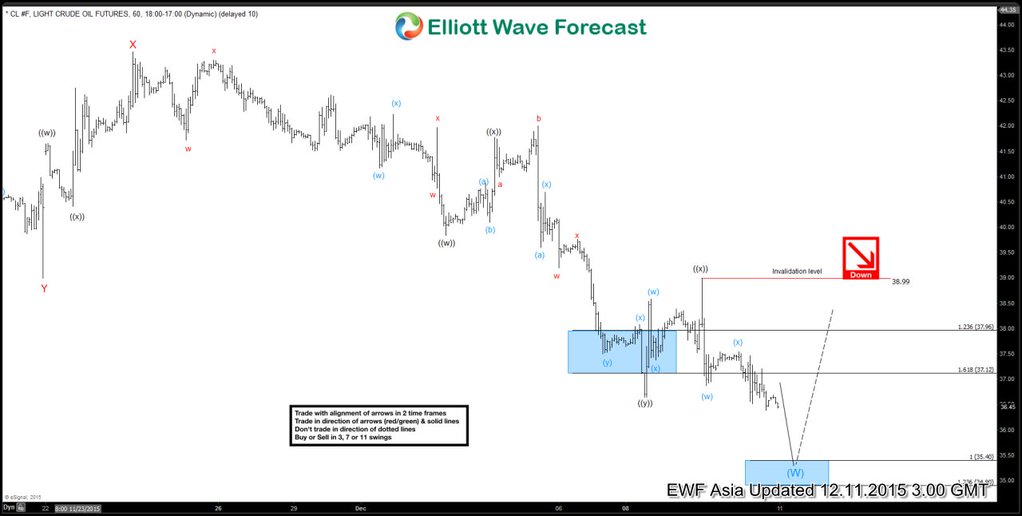
Interestingly, without the benefit of a hindsight of what OPEC may or may not do during the last meeting, we have been able to forecast the short term move lower in oil through the study of Elliott Wave cycles as shown from the December 11 short term 1 hour chart below
The technical study of Elliottwave distribution and cycle can also be used to help forecast the longer term direction of Oil as this old video made in 2011 shows how we were able to call Oil lower to around $20 when it was still at $100.
It’s certainly interesting and helpful to understand the fundamental dynamic of a particular instrument. Equally helpful or sometimes can even be more helpful however is a good technical study, such as Elliottwave analysis, to complement any fundamental analysis, as Elliottwave cycles can be used to identify the market’s intention earlier than the crowd. If you would like to know more about how Elliottwave forecast can help your trading, try our service 14 days FREE
Back


