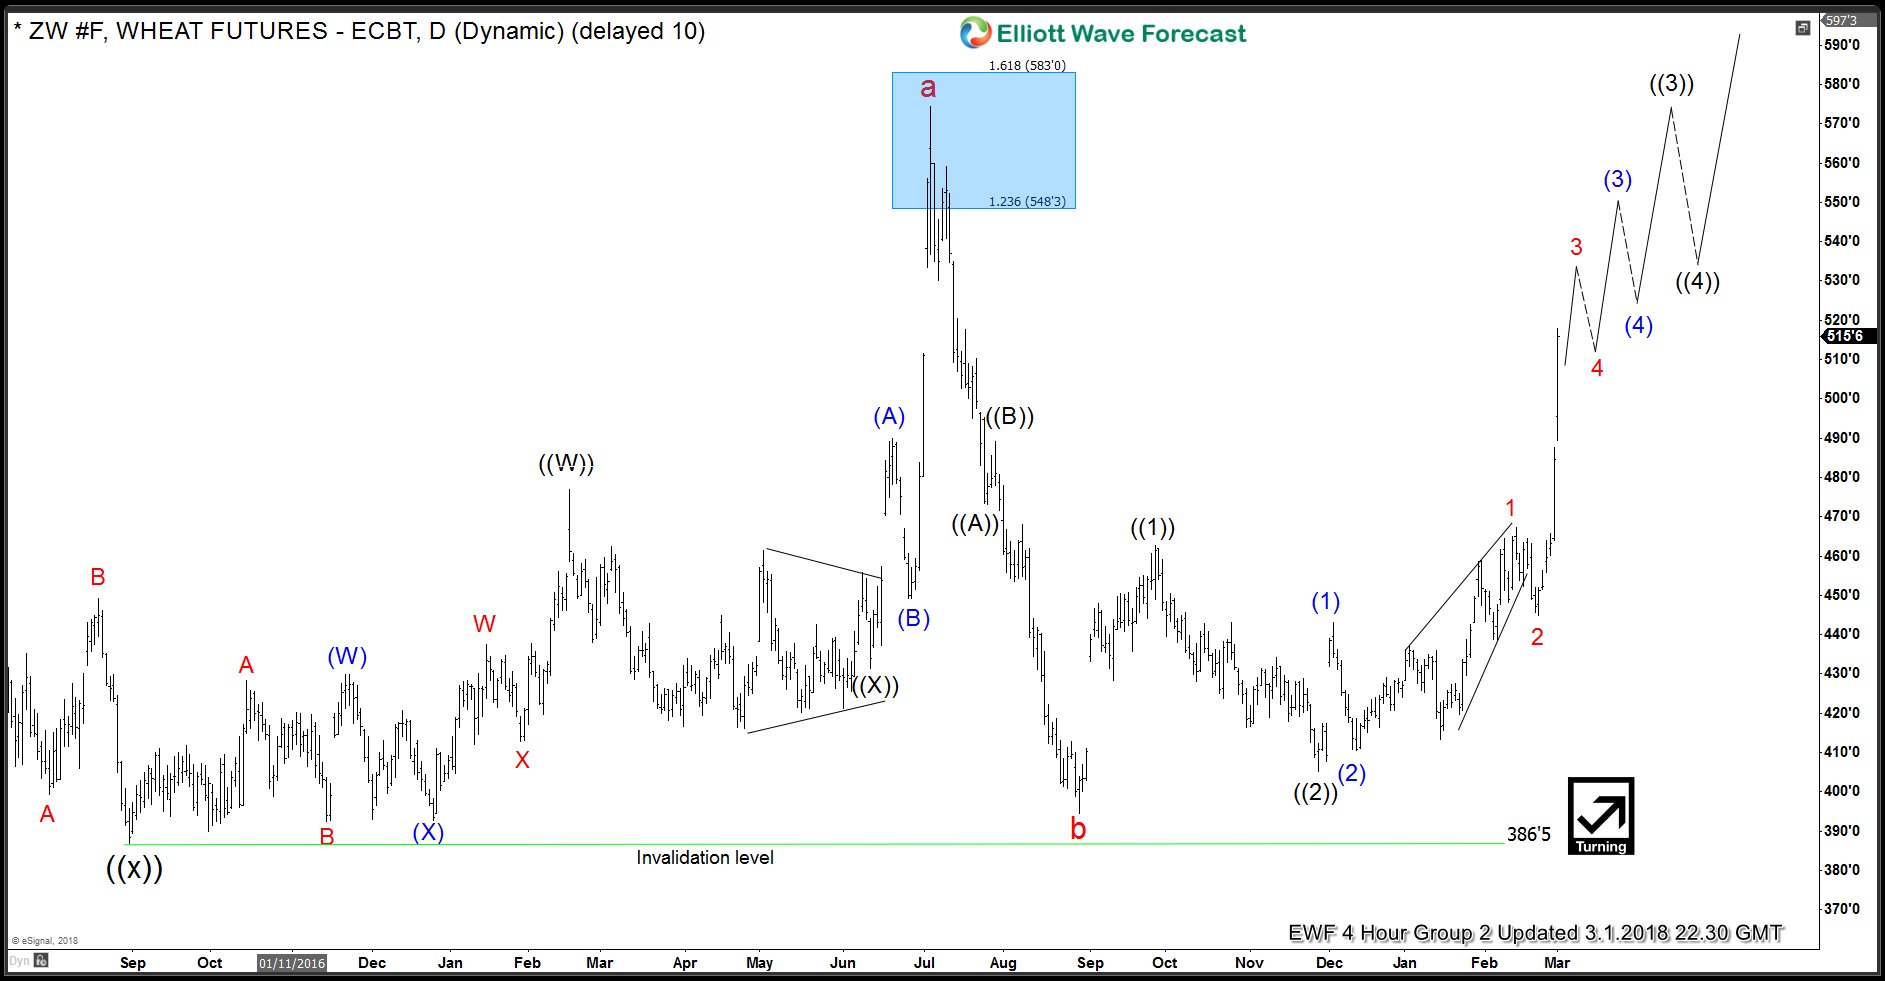
Wheat futures have rallied nearly 13% this week from an opening price of 455 to a high of 518 so far, so we decided to present Wheat Elliott Wave analysis to every one and show how we are viewing this rally and what we think will happen according to our analysis going forward. Wheat futures have gone past 1.618 extension of the first rally from 8.29.2017 low due to which we think that rally from 8.29.2017 low would unfold as an impulse and not in a corrective fashion because in a corrective structure wave C or Y would end below 1.618 extension of wave A-B or W-X.
When we zoom out, we see that rally from 8.31.2016 (386’6) low to 7.5.2017 (574’4) was not an impulse but rather a double three Elliott wave structure labelled as ((W))-((X))-((Y)). If that rally was in 3 waves and the rally from 8.29.2017 low is expected to become an impulse, that suggests we are looking at a FLAT Elliott wave structure which is a 3-3-5 structure and we are currently in wave “c” of the Elliott wave FLAT structure and as prices hold above 50% of the rally from 2.22.2018 (444’6) low (currently at 481’4), we should expect to see more upside towards 581 – 626 area to end the cycle from 8.31.2016 low. If price drops below 50% of the rally from 2.22.2018 low, then the impulsive structure from 8.29.2017 low would be negated and the structure from 8.31.2016 low would become a double three structure in which we should still hold 8.29.2017 low for another leg higher towards the same target area (581 – 626).
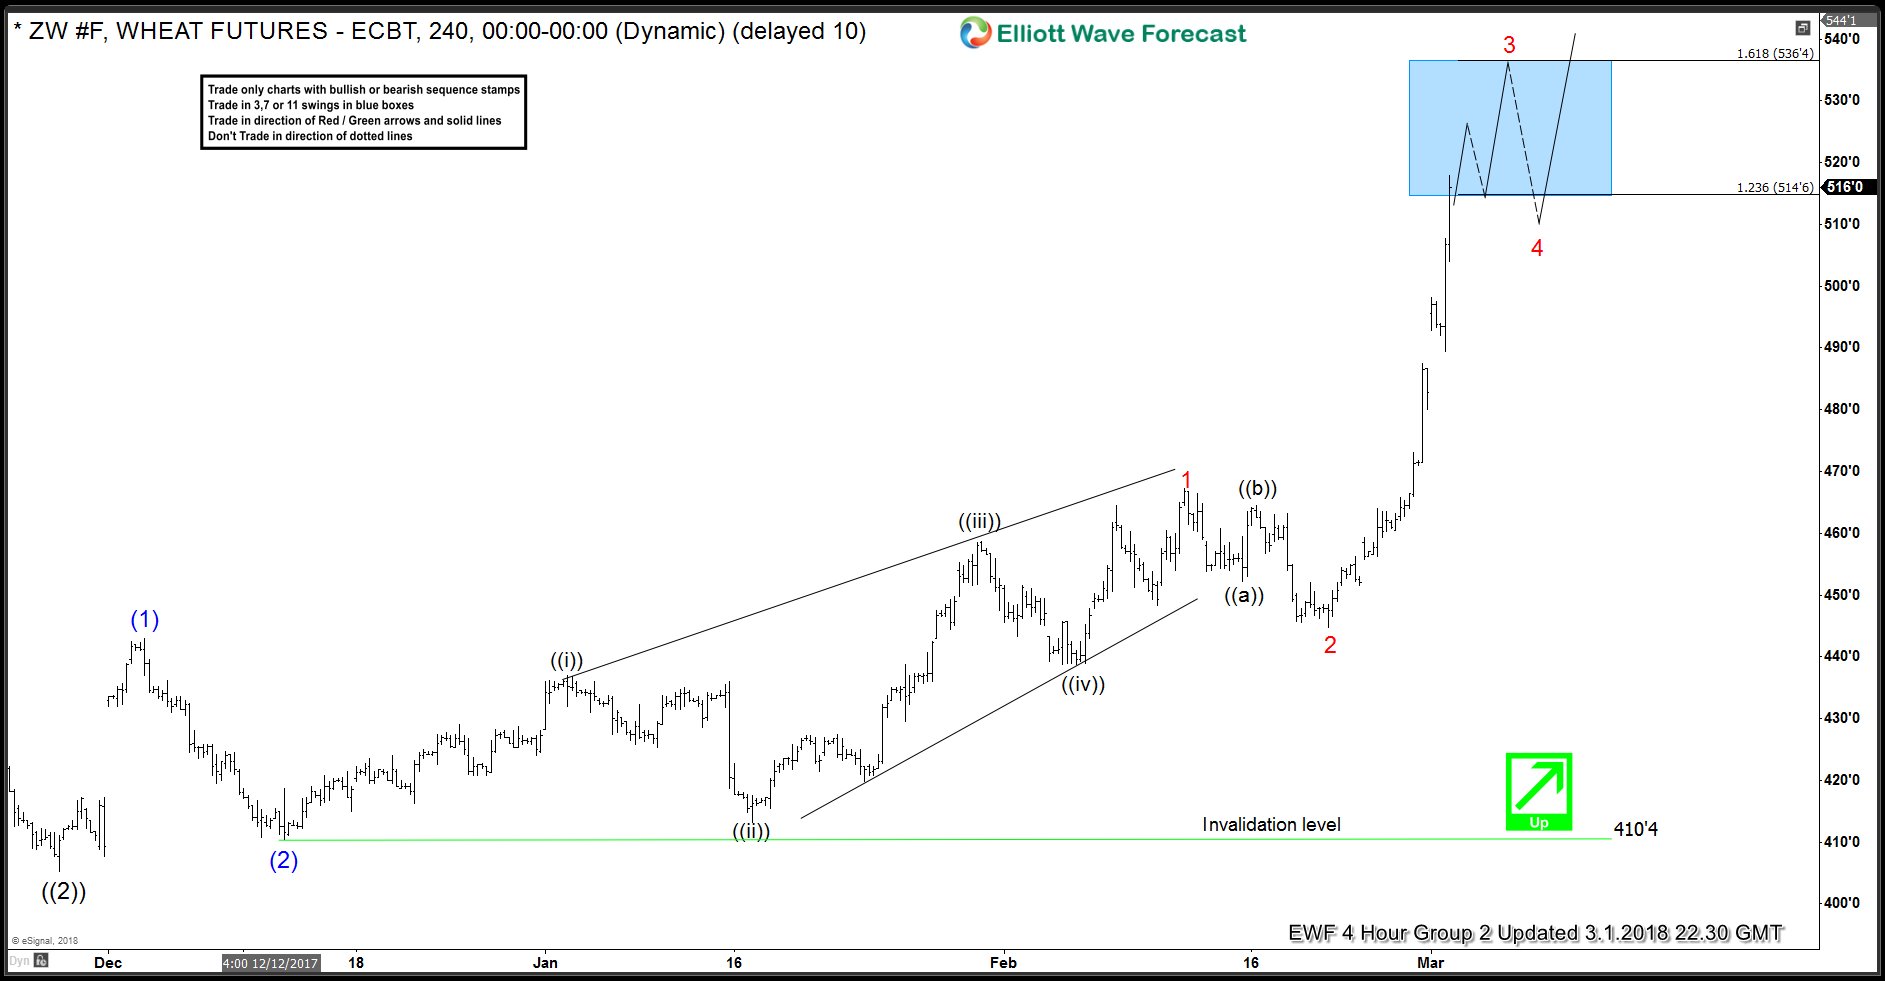
A look at the 4 hour Wheat Elliott wave chart suggests, we are in extended wave 3 of (3) of ((3)) and ideal level for the red wave 3 to end would be 536’4 or higher. After that, we should expect a pull back in red wave 4 to correct the cycle from 2.22.2018 (444’6) low and continue higher in red wave 5 to complete blue wave (3). We don’t like selling Wheat futures and expect to see buyers appearing in various wave 4 pull backs in 3-7-11 swings looking for higher prices towards 581 – 626 area.
Wheat Elliott Wave Analysis: 5 Waves Advance
Wheat Elliott Wave Chart: Daily Time Frame
Wheat Elliott Wave Chart: 4 Hour Time Frame
Back


