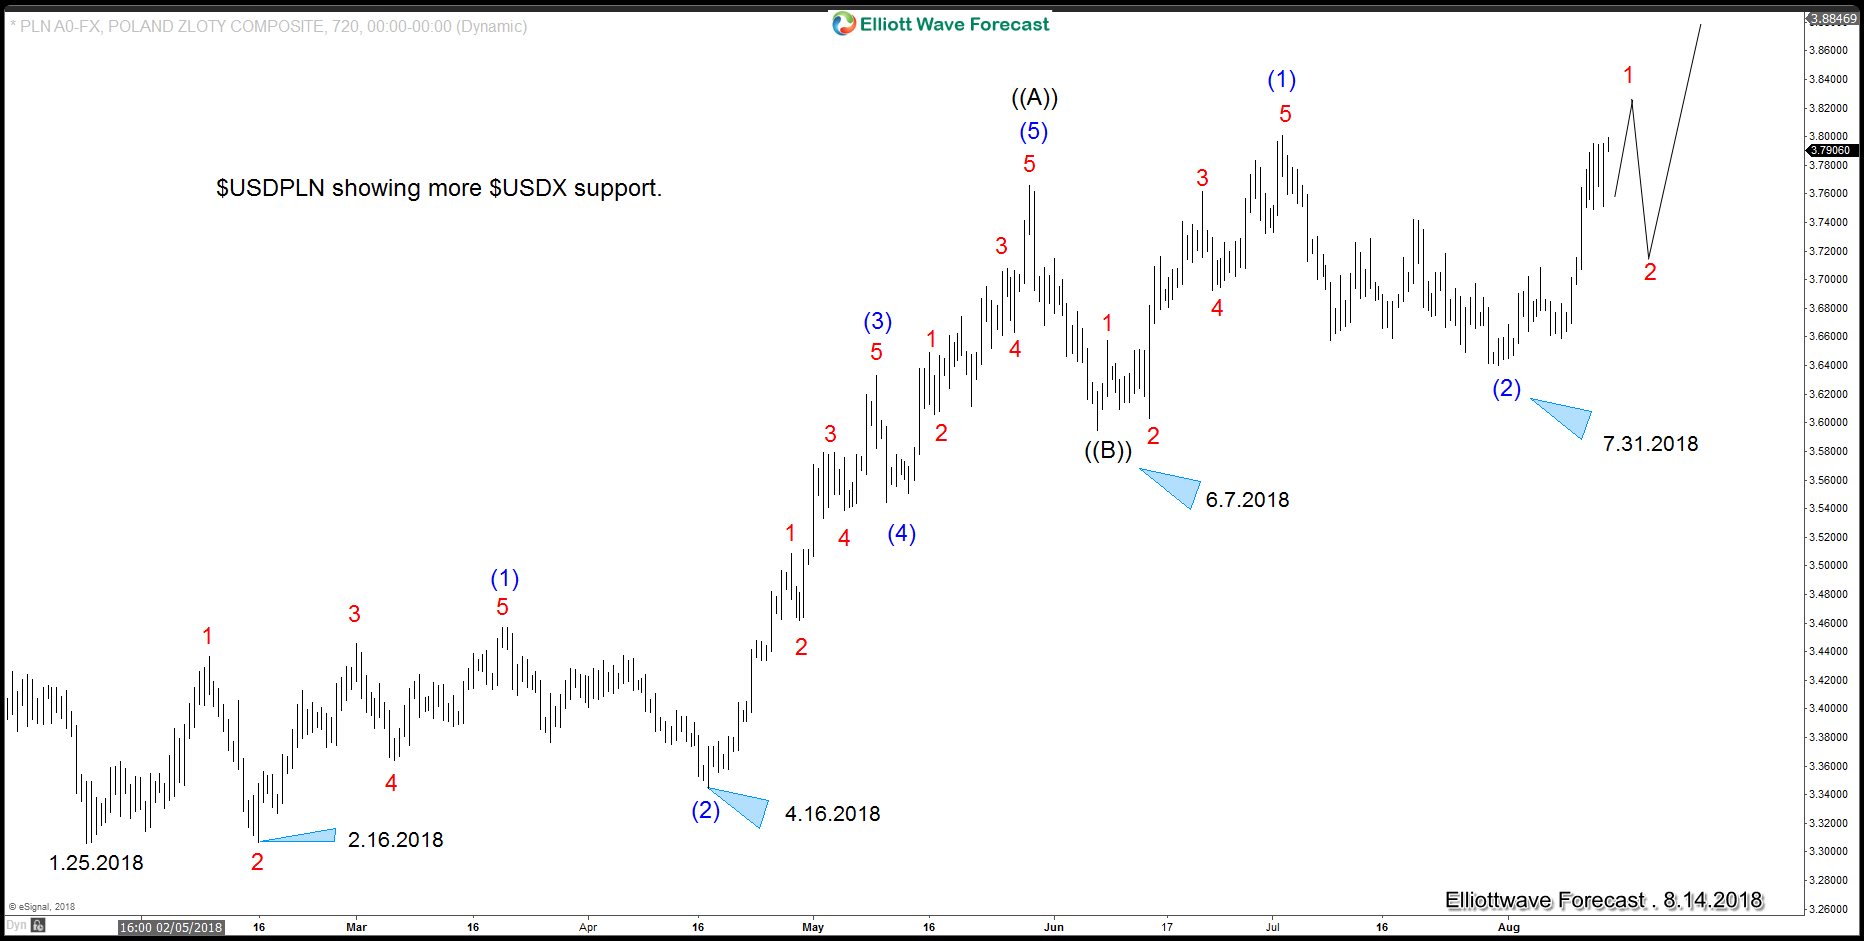
USDPLN is always a very interesting Forex pair within the US Dollar group and most of the times shows the path for the Index. USDPLN is showing an incomplete Elliott wave swings sequence since the lows at 1.25.2018 in which the first leg was an Elliott wave impulse i.e. wave ((A)), then it did 3 waves back i.e. wave ((B)) and now showing 3 waves higher since the low at 6.7.2018. The structure from 6.7.18 should not be completed and either it is a nest higher or wave ((C)) is taking the from of a diagonal and we are still in wave (1) of ((C)) towards 3.84 – 3.89 area where as target for wave ((C)) lies in 4.08 – 4.20 area. As we shown in the chart below, new high above black ((A)) and then another new high above blue (1) peak creates the incomplete sequence which support higher USDPLN and consequently the USDX as far as pull backs stay above 7.31.2018 low and more importantly above 6.7.2018 low.
USDPLN: 4 Hour Elliott Wave View
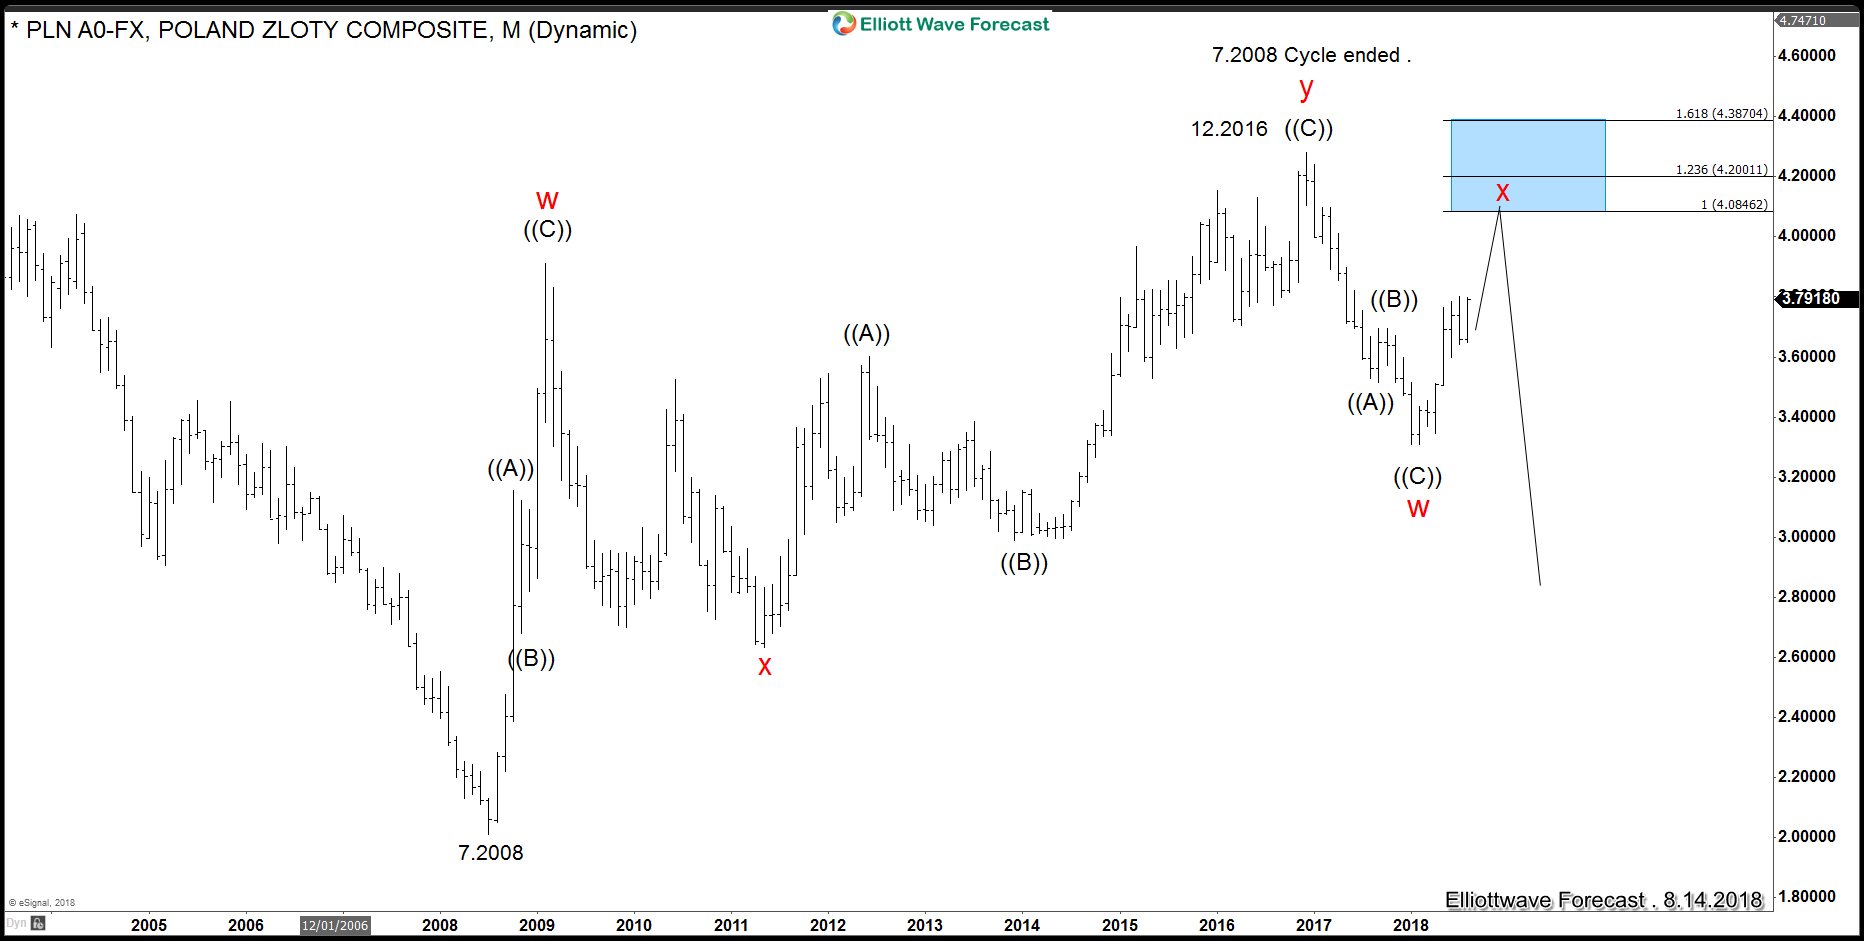
Also, we explained at video the long term view of the $USDX, we shown the chart from 1971 in which the Deutsche Mark and $EURUSD are shown together showing 5 swings which either is 5 swings or 5 waves, if the advance is 5 swings, then the $USDX have a chance to see all time lows and 2017 peak it is a huge peak, at the other hand, if the advance is 5 waves in a form of a Diagonal, then the Index will pullback in 3 waves and this recovery is a X wave which should fail when $USDPLN reach the 4.08-4.20 area, as shown in the chart below.
USDPLN Long-Term Chart

After rejection in the blue box, expect drop in another leg before strong $USDX buyer show up around the 50-61.8% of 2008 rally and another huge Multi year rally can take place. Understanding the right side, cycles and sequences in each time frame is key, there is not need to force any side, but trade the Elliott wave Hedging is the best trade at this moment for the $USDX.

