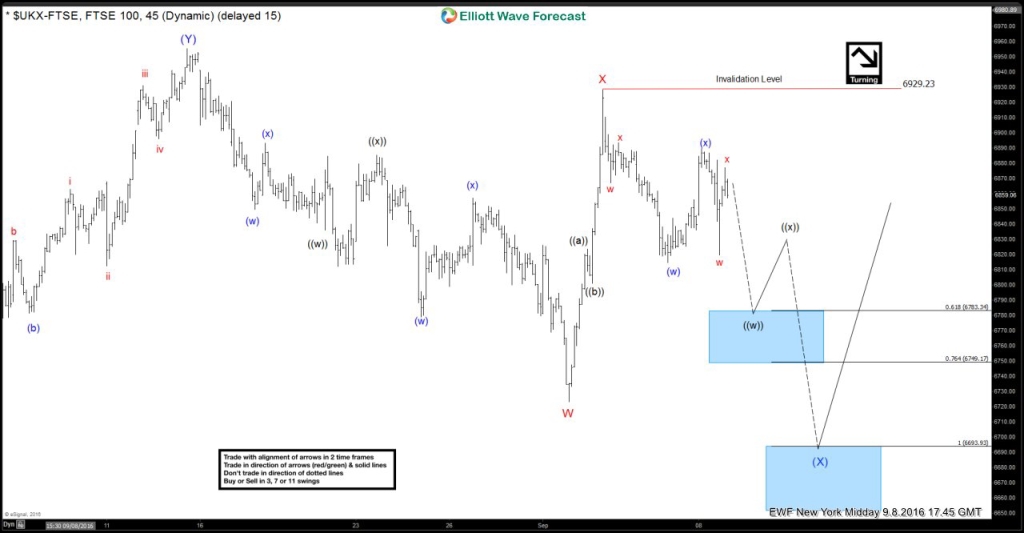
On 8th of September 2016, Our Strategy of the Day Video presented to clients viewed the pullback in $FTSE as a buying opportunity in the index.
Long $FTSE 9.8.2016
$FTSE has rallied in 7 swing and reached 100% Fibonacci extension of first 3 swings up from February 2016 lows already, however some other Indices are still incomplete sequence which means the cycle from February lows in the index could extend higher as triple three structure to allow other Indices to complete their respective sequences. So our strategy was to buy dips in the index in sequence of 3, 7 and 11 swings as far as pivot at 6/24 (5788.54) low remains intact.
Charts
$FTSE index while below 9/2 peak (6929) it was expected that it should do extension lower to reach 100% Fibonacci extension area from August 15 peak around 6693 in 7 swing sequence before buyer’s appear again in the index for continued strength higher for new highs above August 15 peak (6955) or bounce in 3 waves at least. Index reached a low of 6654.82 on 9/15 triggering the longs at 6693 area and bounced strongly which allowed us to get into a risk free position. Index needs to break above August 15 (6955) peak to confirm the next leg higher has started, until then more consolidation or even another low below 6654.82 can’t be ruled out but that won’t affect as we are already in a risk free position and this happened because using our technical analysis tools, we were able to identify the turning area from where we knew the buyers would most likely product a 3 wave bounce at least.
To access Strategy of the day and week videos and access Elliott wave forecasts for 52 instruments, feel free to sign up for Free for 14 day Trial (available to new members only).
Back

