On Friday, 25th May 2018, we conducted a Free public Webinar on SPX and explained how we view the $SPX over the coming years. Many analysts are bearish and are expecting a crash to start soon, our forecast says otherwise, watch the free seminar’s recording to see why we think SPX can reach 4000 level in the years to come. We also explained the key area that needs to break to confirm a move to 4000 area and what other World Indices are supporting this move.
SPX: How We Can Reach 4000
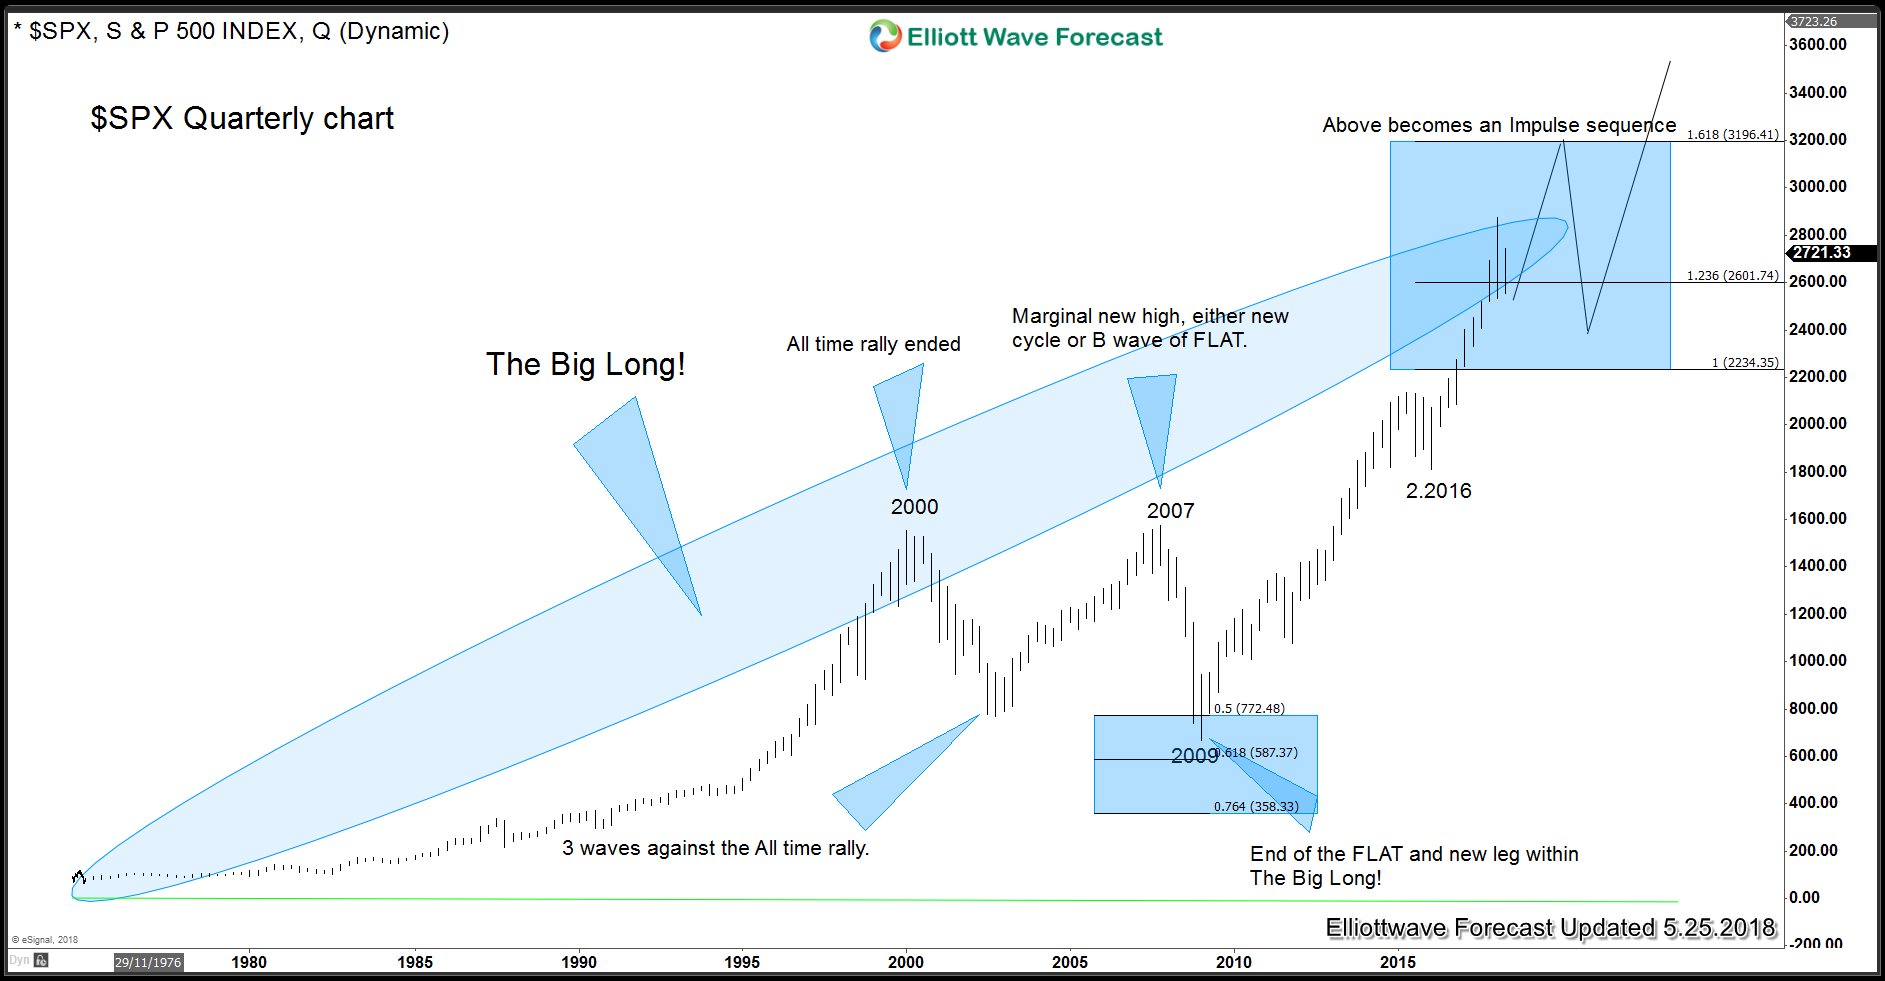
SPX Weekly: The Big Long
Chart above shows the big long in $SPX which is in progress from all time low. $SPX Rally from all time low to 2000 peak was an Elliott wave impulse which was followed by a FLAT correction into 2009 low. Rally from 2009 low has already reached the extreme area from all time low – 2000 peak related to 2009 peak. As far as price stays below 3196 (1.618 Fibonacci extension), it is a 3 waves move i.e. ABC. However, FTSE and ASX charts below support the view that 3196 would be exceeded. A break above 3196 would make The Big Long even bigger and would suggest Index is an impulsive sequence from all time low with wave 3 in progress.
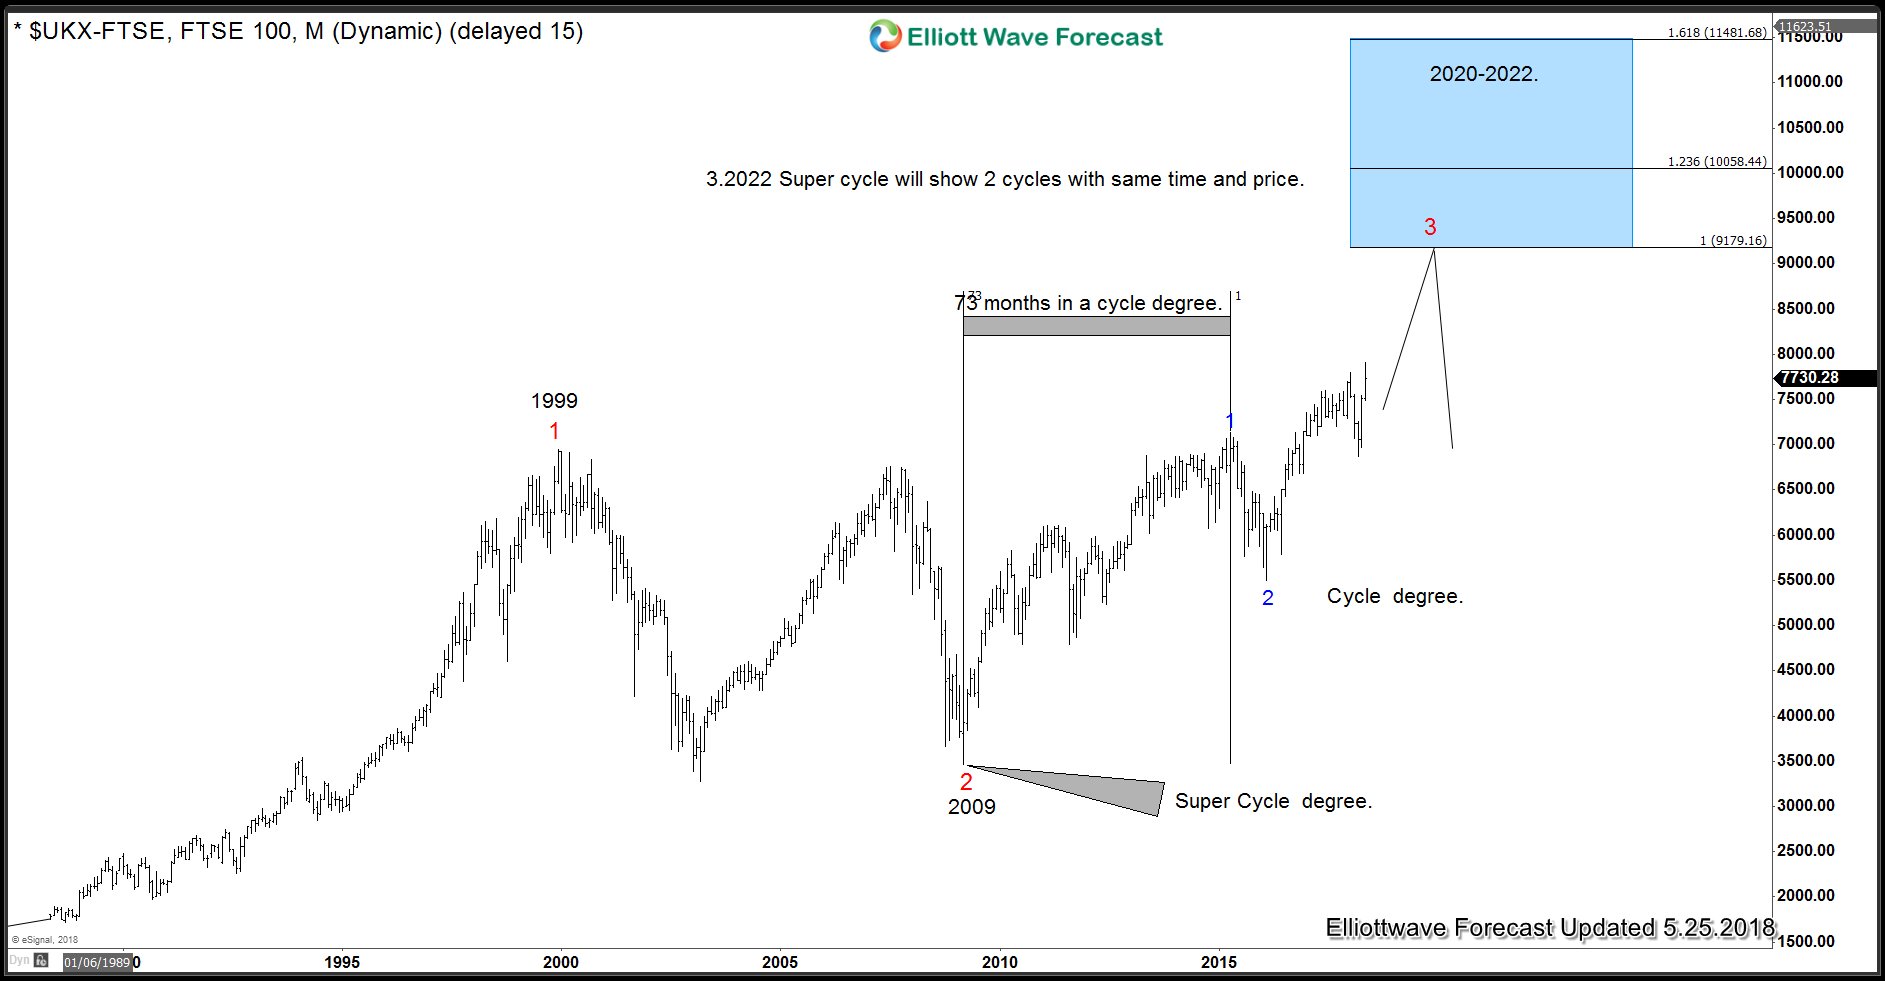
FTSE Time and Price Sequence
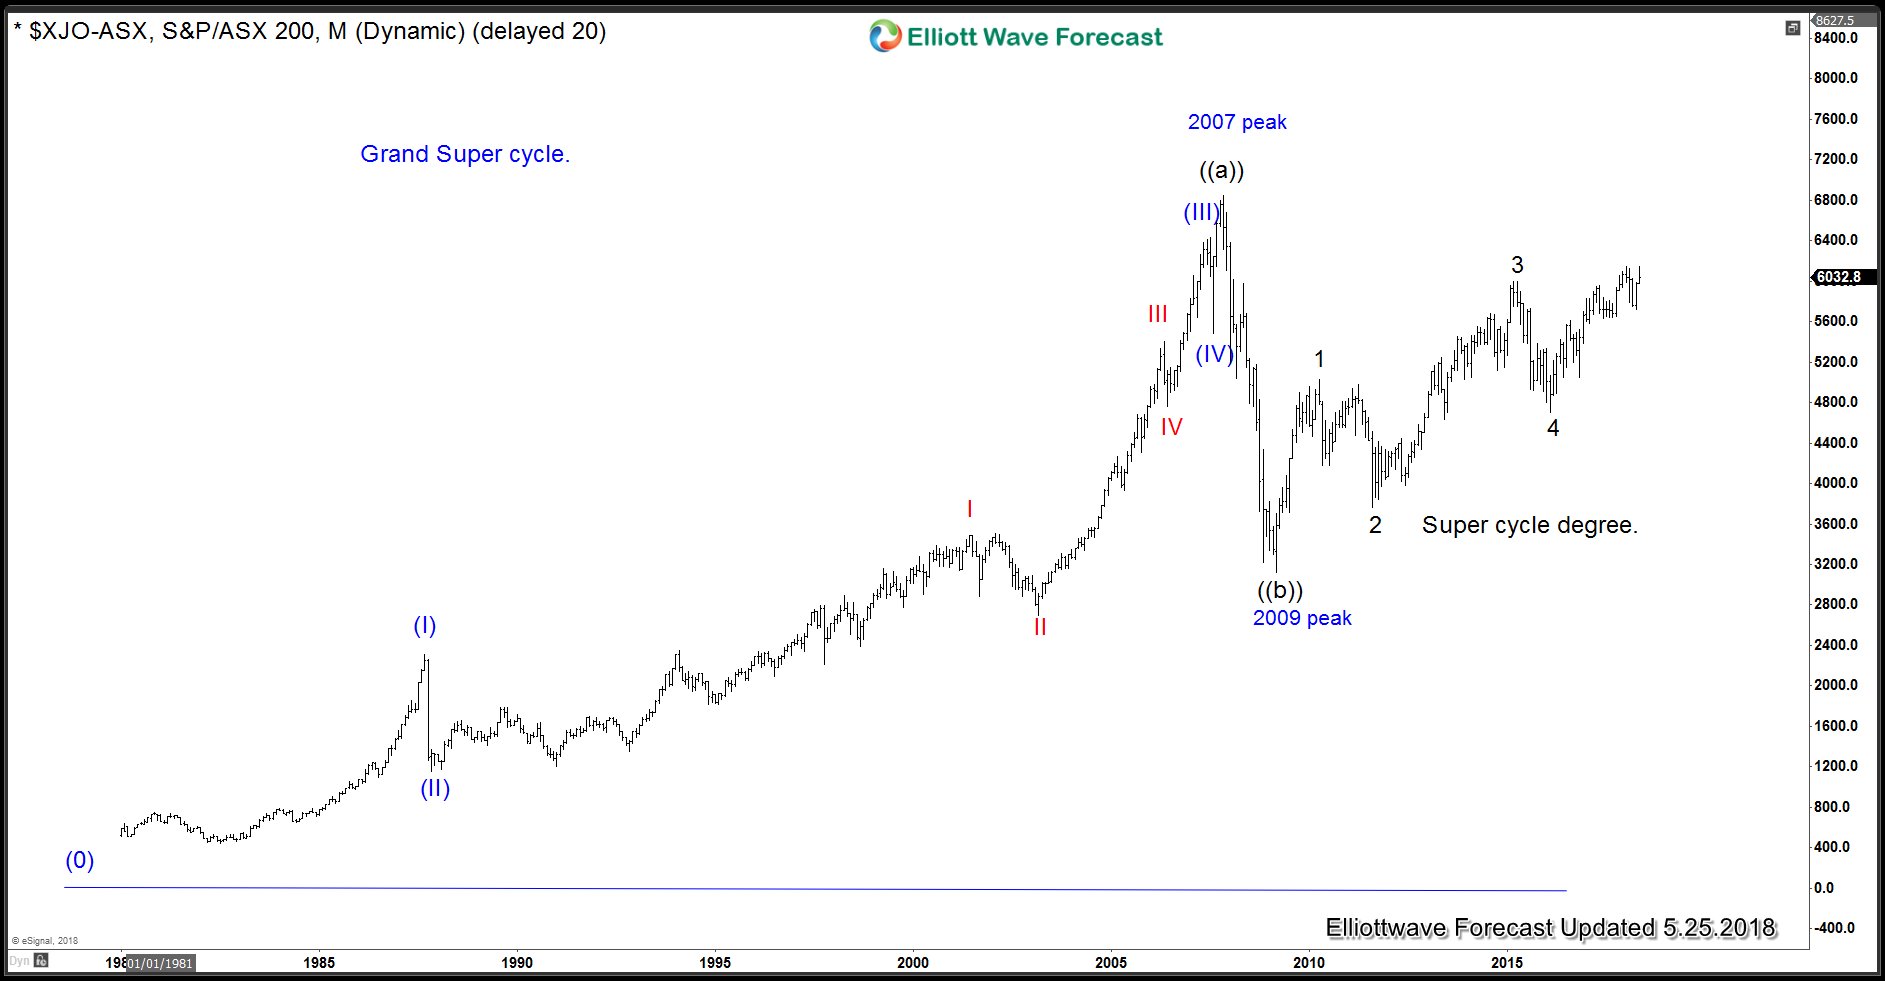
ASX (All Ordinaries Index) Super Cycle
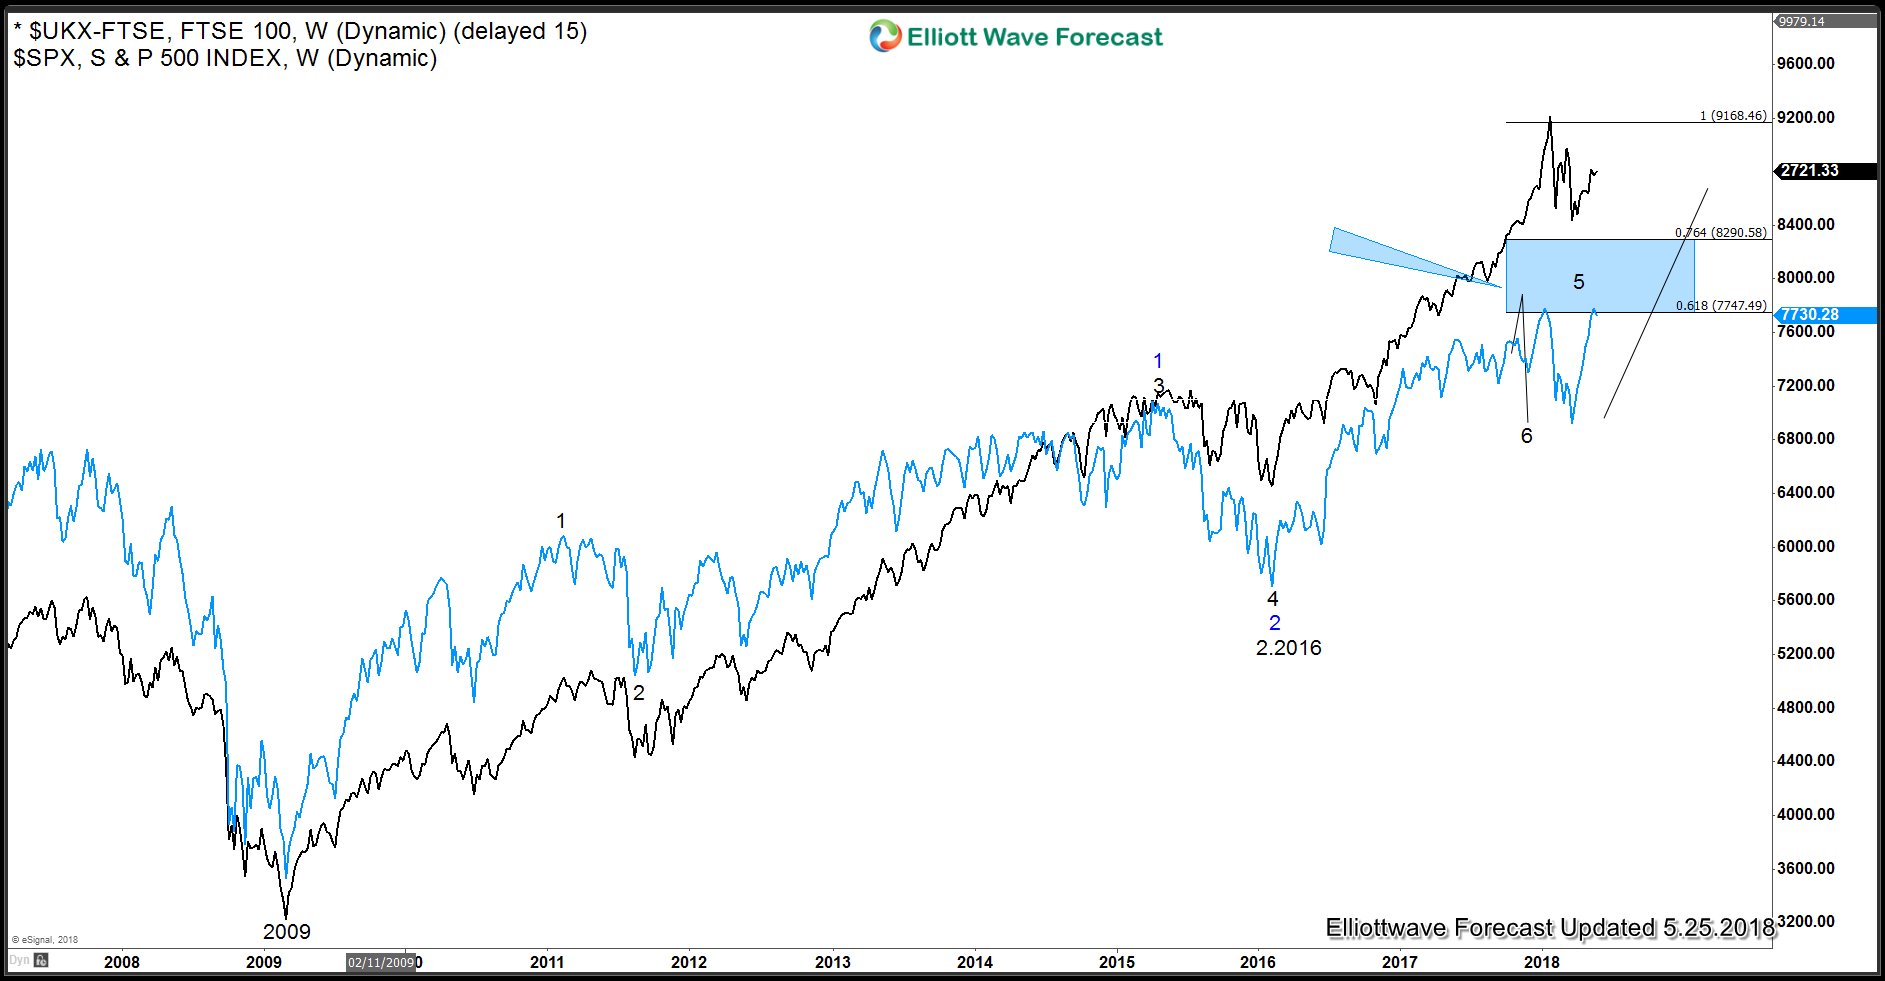
FTSE Overlay
We provide precise forecasts with up-to-date analysis for 78 instruments. These include Forex, Commodities, World Indices, Stocks, ETFs and Bitcoin. Our clients also have immediate access to Market Overview, Sequences Report, 1 Hour, 4 Hour, Daily & Weekly Wave Counts. In addition, we also provide Daily & Weekend Technical Videos, Live Screen Sharing Sessions, Live Trading Rooms and Chat room where clients get live updates and answers to their questions. The guidance of ElliottWave-Forecast gives subscribers the wherewithal to position themselves for proper entry and exit in the markets. We believe our disciplined methodology and Right side system is pivotal for long-term success in trading.
Back


