Energy Inc. (CVI) stock can be one of the most telling instruments across the Market today. The instrument is showing a Bullish sequence in the Daily and 4 Hour timeframe, making the right side to the upside.
We at Elliottwave-Forecast have taken the orthodox Elliott Wave Theory and made some changes to the existing Theory. A new concept which is more related to today’s trading environment.
We have created the so-called sequences and Blue Boxes and a lot of other tools which we are using on a daily basis to locate the Right Side of the market. The initial concept is very simple to understand. Now, let’s have a look at the actual Energy Inc. stock.
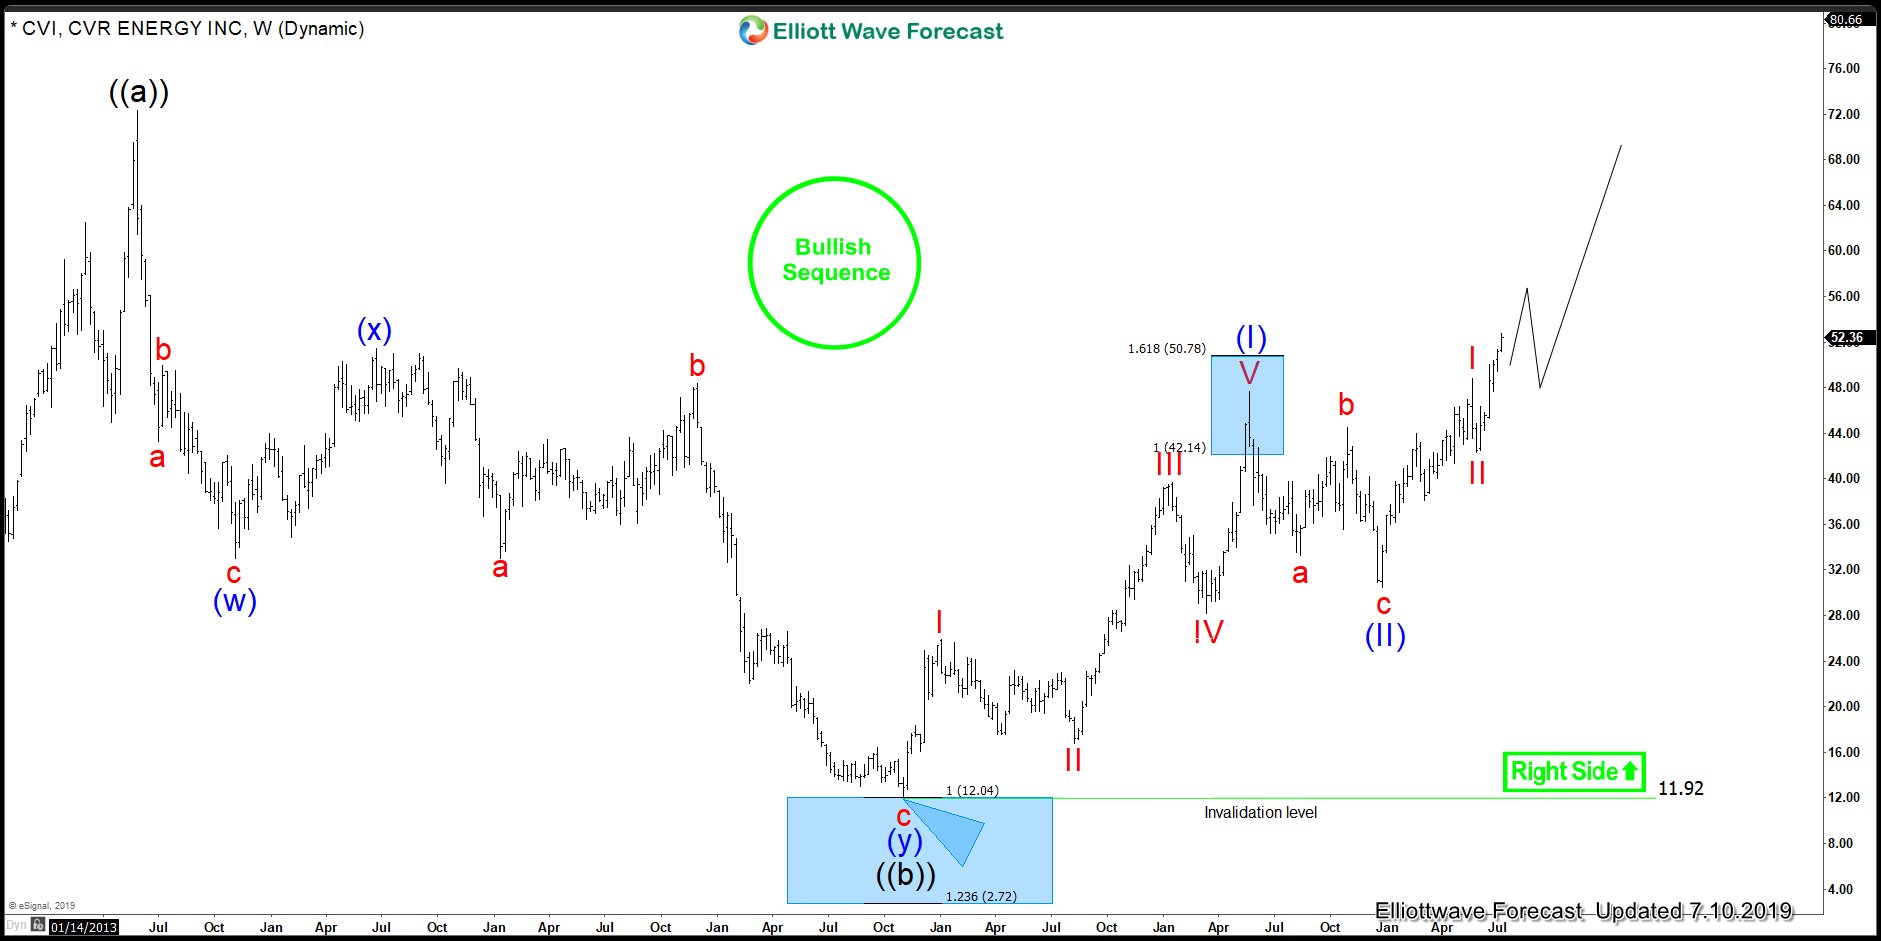
CVI reached perfectly in the past the equal legs of blue (w)-(x) towards 12.04+ areas and in the same year Oil created a low. The bullish sequence in CVI will eventually support Oil into the $100.00 area. This provides the clue for the whole Energy sector, making them also bullish. Instruments like XOM and CVX will be supported against the December 2018 lows and their Mai 2019 lows as well. That gets confirmed when both take their Mai 2019 peak. The following chart is showing CVI in the weekly timeframe.
Energy Inc. Weekly Elliott Wave Analysis 7.10.2019
The weekly view in Energy Inc. is showing why it is bullish and consequently should support Oil and other energy stock as well. Therefore, we would like to buy Energy Inc. against the red II low in the first and against the blue (II) in the second degree. But most importantly, we do not like selling any Energy sector related instruments because the overall right side is higher. Also, this sequence in CVI supports World Indices because they have an alignment with the right side as well.
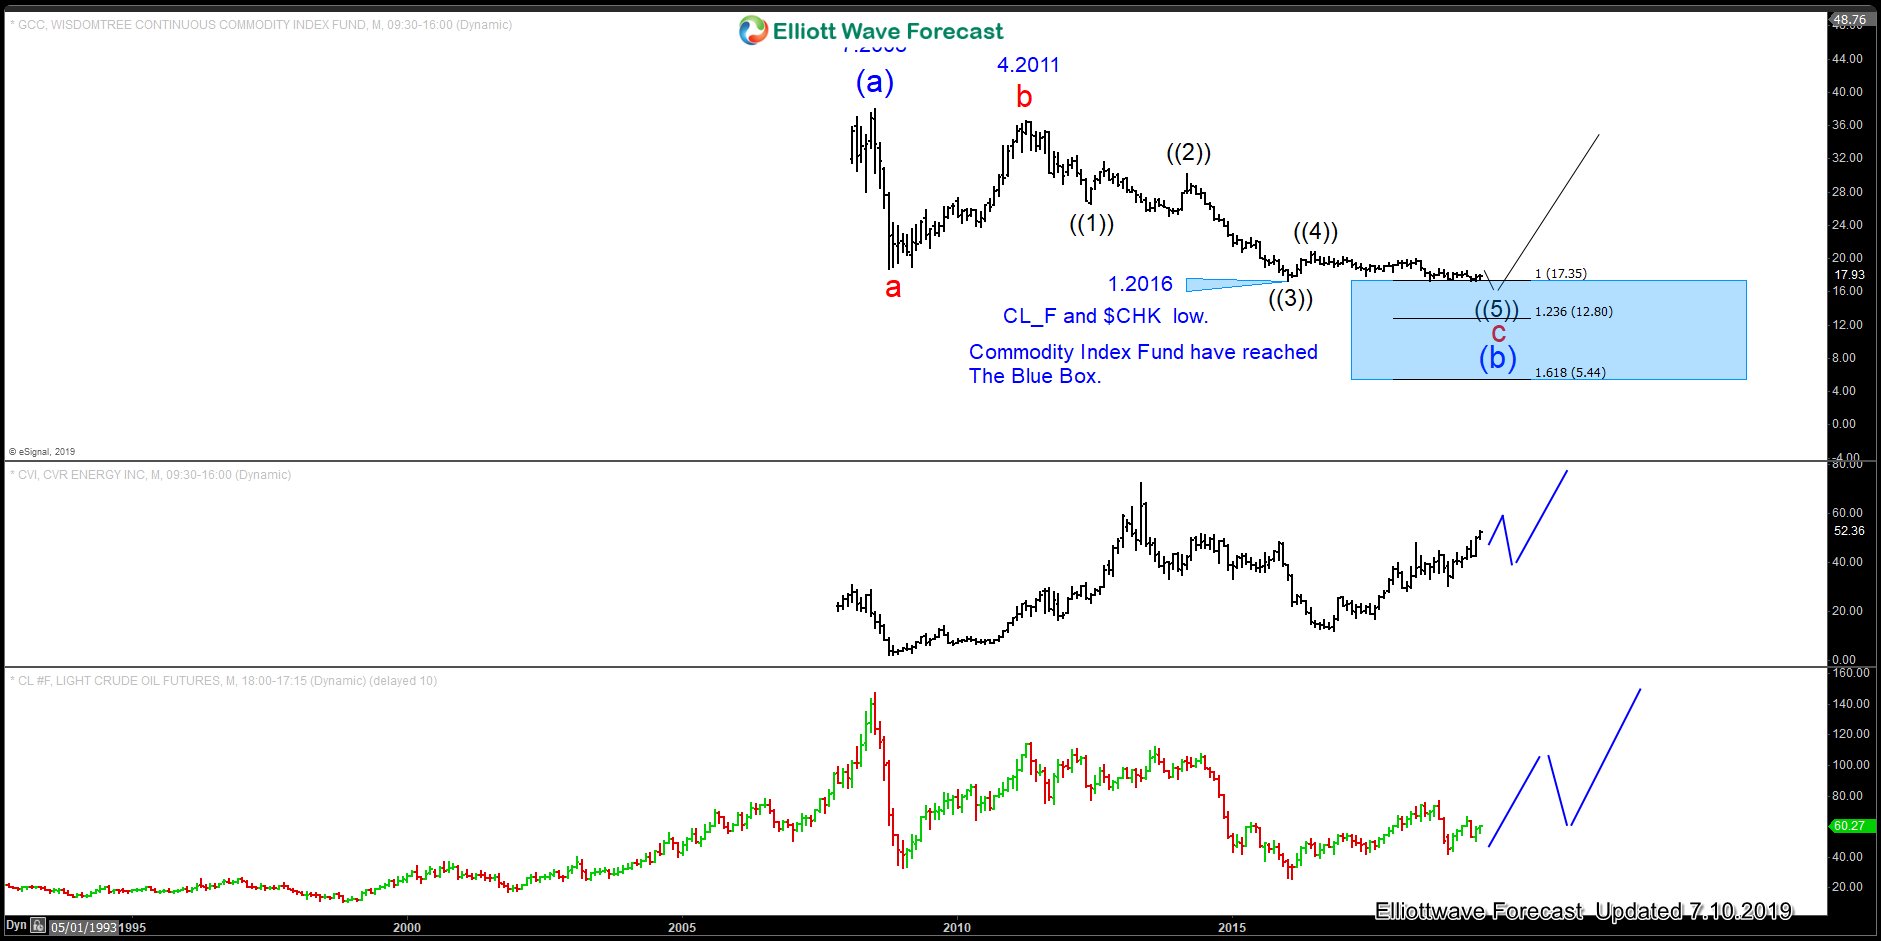
GCC Overlay with CVI and Oil 7.10.2019
The Chart above is showing the relation between CVI, GCC and Oil which proves the idea that the Market trades the same side. Noteworthy is the idea that GCC is within a weekly Bullish buying area, which will add more conviction to the CVI bullish sequence and consequently to the whole energy sector. The following video explains the idea of ENERGY INC. price action and the relationship with Oil, GCC CHK and more.
Back


