Hello Traders and Investors. In today’s article, we will take a look at the Elliott Wave structure of GameStop ($GME) and explain why a tremendous rally might be happening to the stock in the near term.
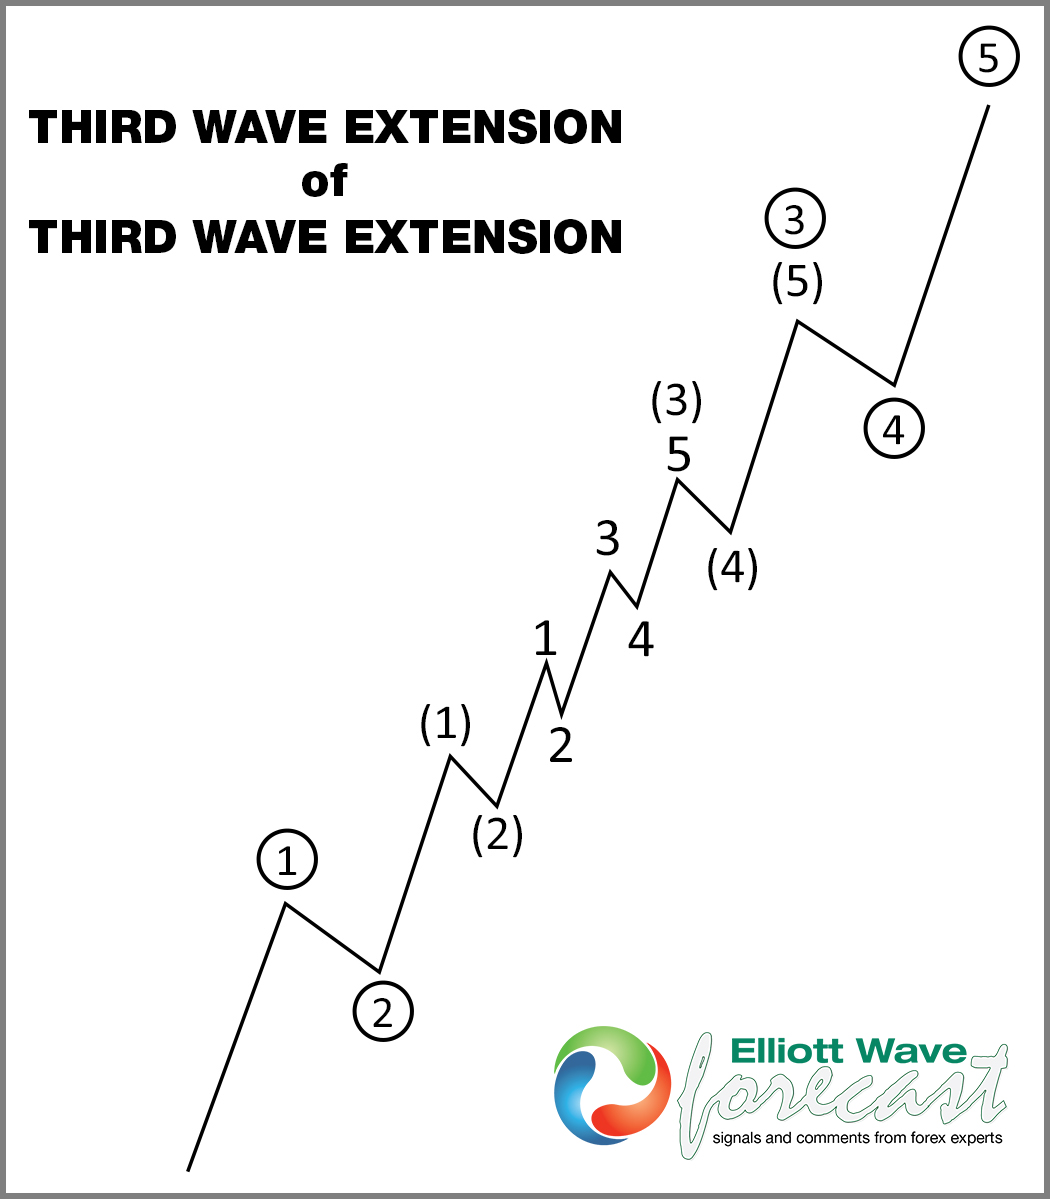
Before we dive into the chart, I want to explain that the overall structure looks like a nest. A nest is a series of 1-2. Most of the time a nest happens before a huge move takes place. The chart below shows what a nest looks like.
Elliott Wave Nest
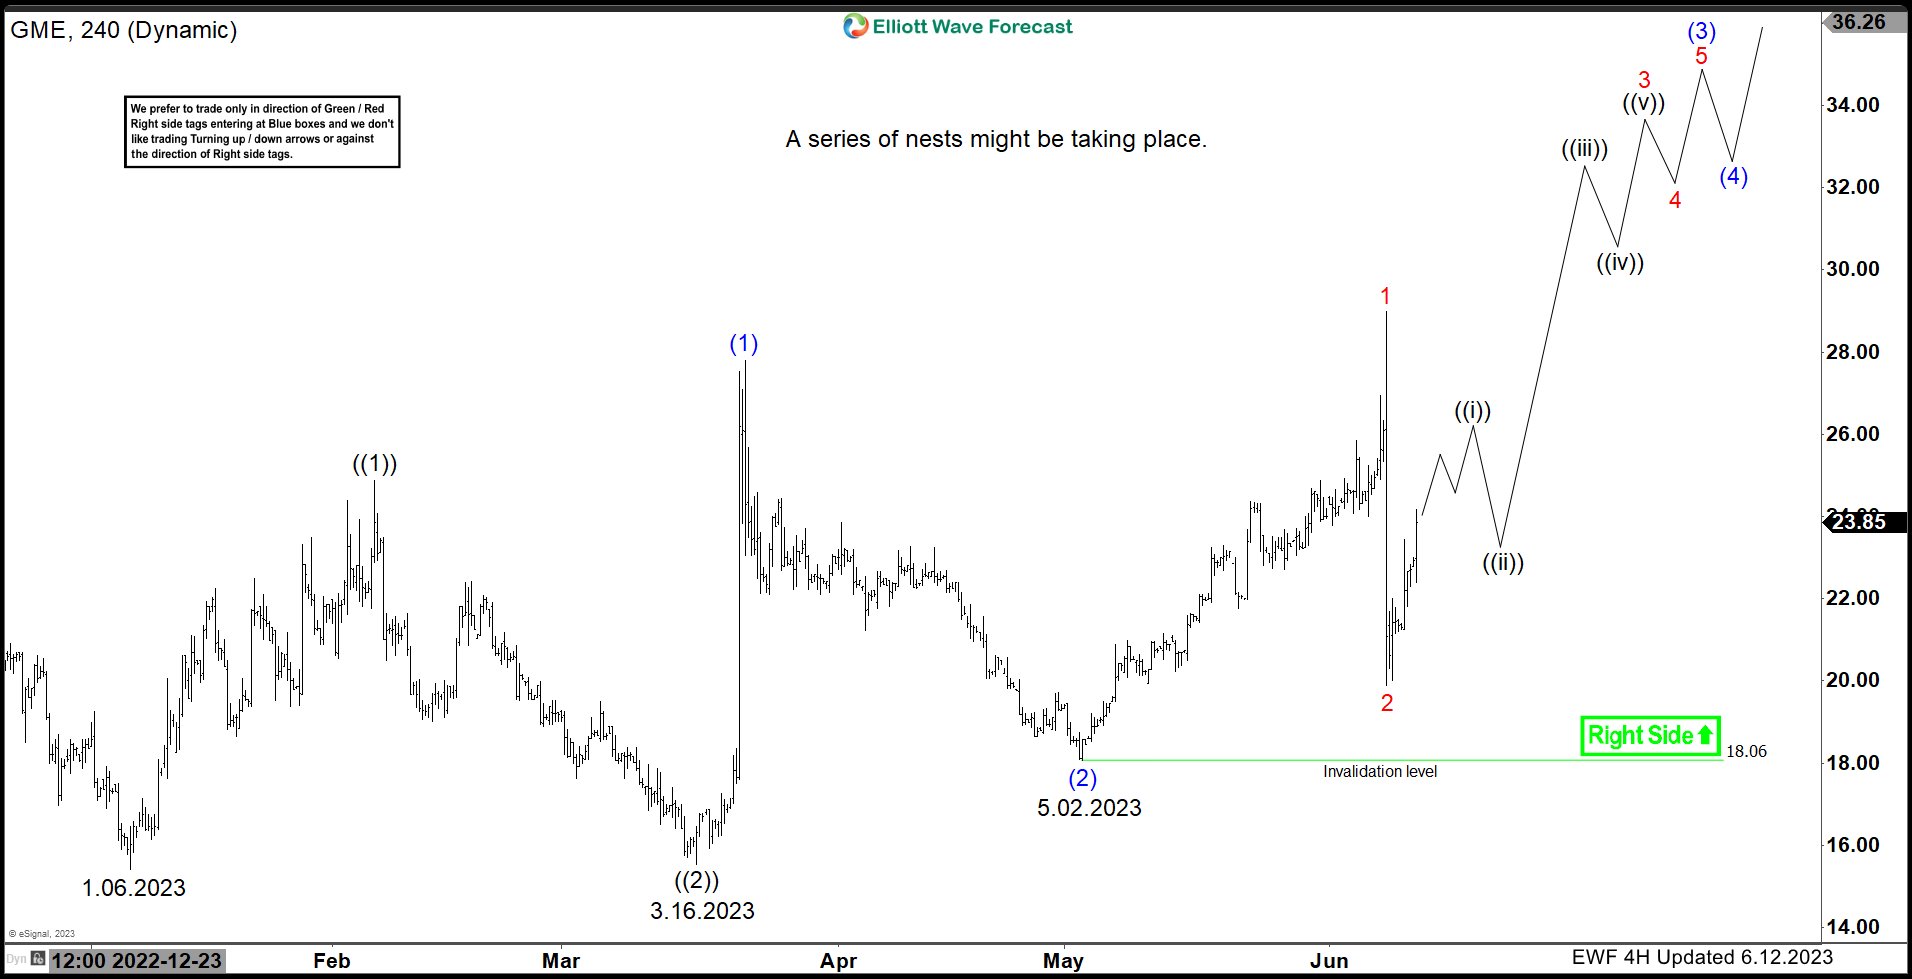
$GME 4H Elliott Wave Chart 6.12.2023:
The 4H chart above shows the reactions higher from the 1.06.2023, 3.16.2023 and 5.02.2023 lows and the series of higher highs and higher lows taking place. In a nesting structure, one needs to observe the RSI readings. The second nest should erase divergence against the first peak and the last nest should come with divergence against the previous peak (Shown in the video below). From here, the stock should remain above $18.06 otherwise the nesting structure is invalidated. Once the wave ((iii)) of 3 starts, we expect the stock to rally towards $55 – 80 before entering into a series of 4s and 5s.
$GME Elliott Wave Video Analysis:
Elliott Wave Forecast
We cover 78 instruments, but not every chart is a trading recommendation. We present Official Trading Recommendations in the Live Trading Room. If not a member yet, Sign Up for Free 14 days Trial now and get access to new trading opportunities.
Welcome to Elliott Wave Forecast!
Back


