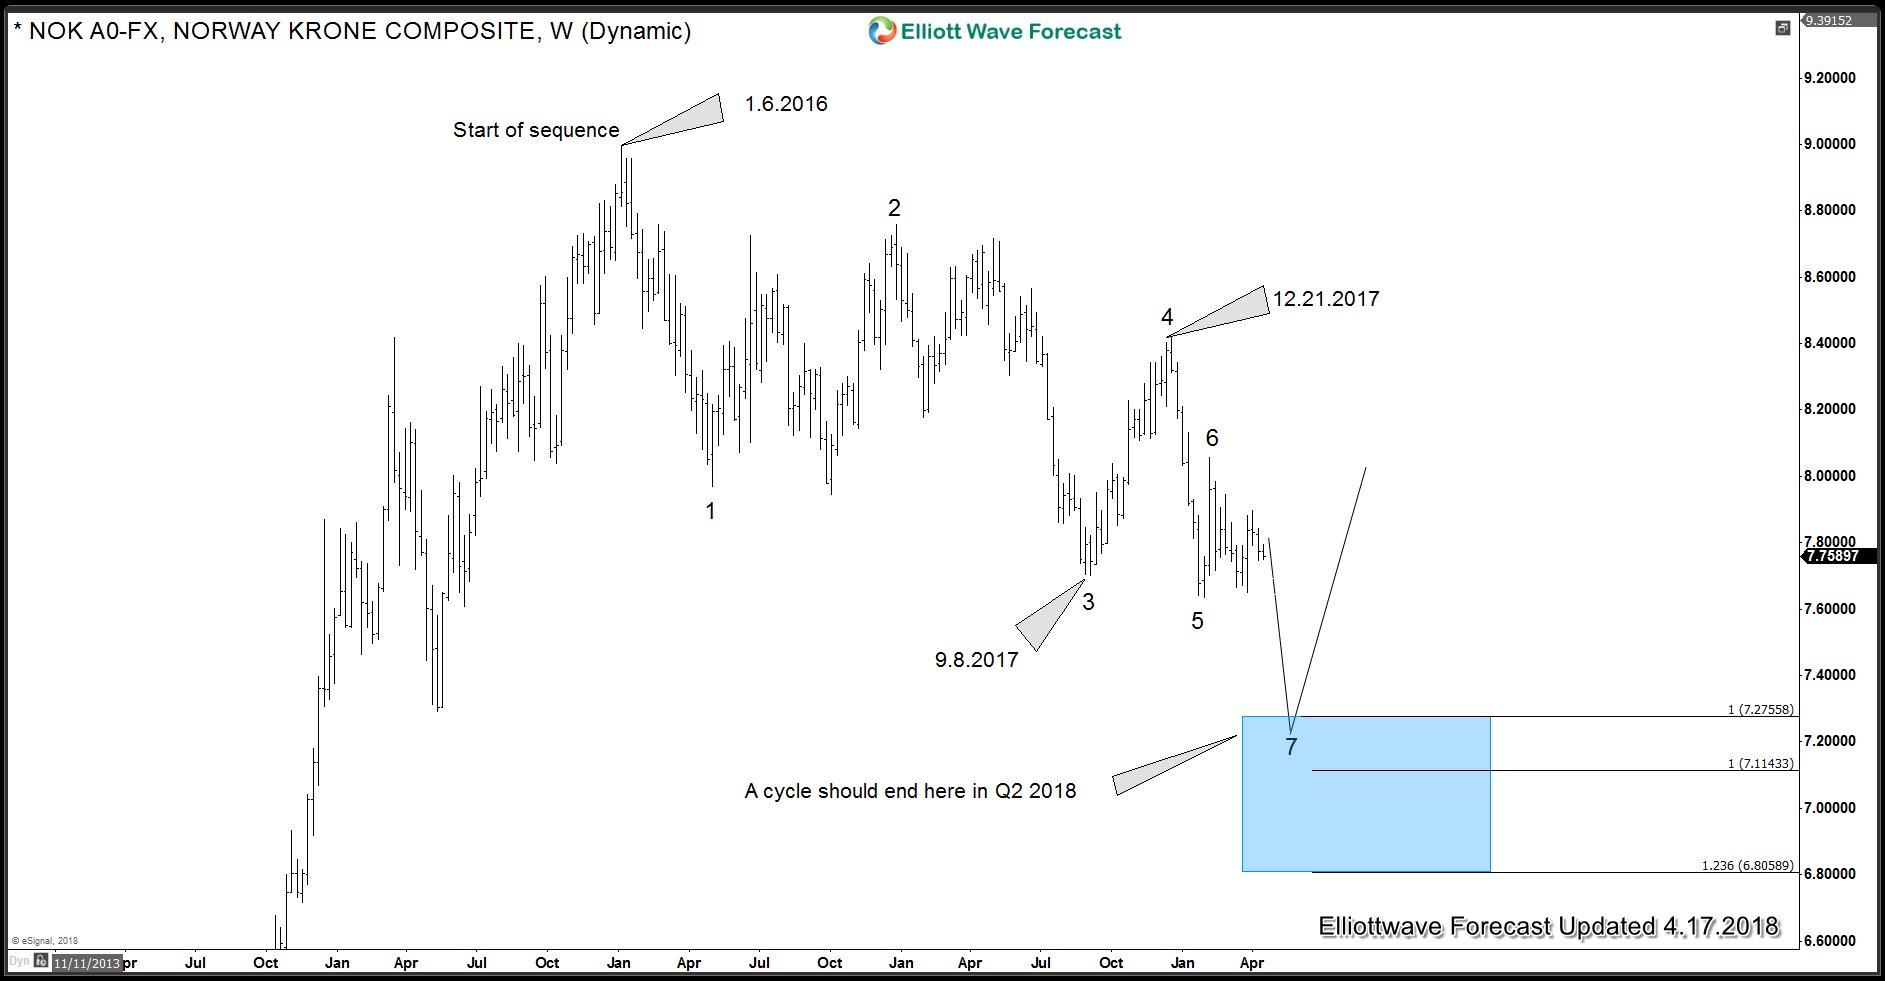
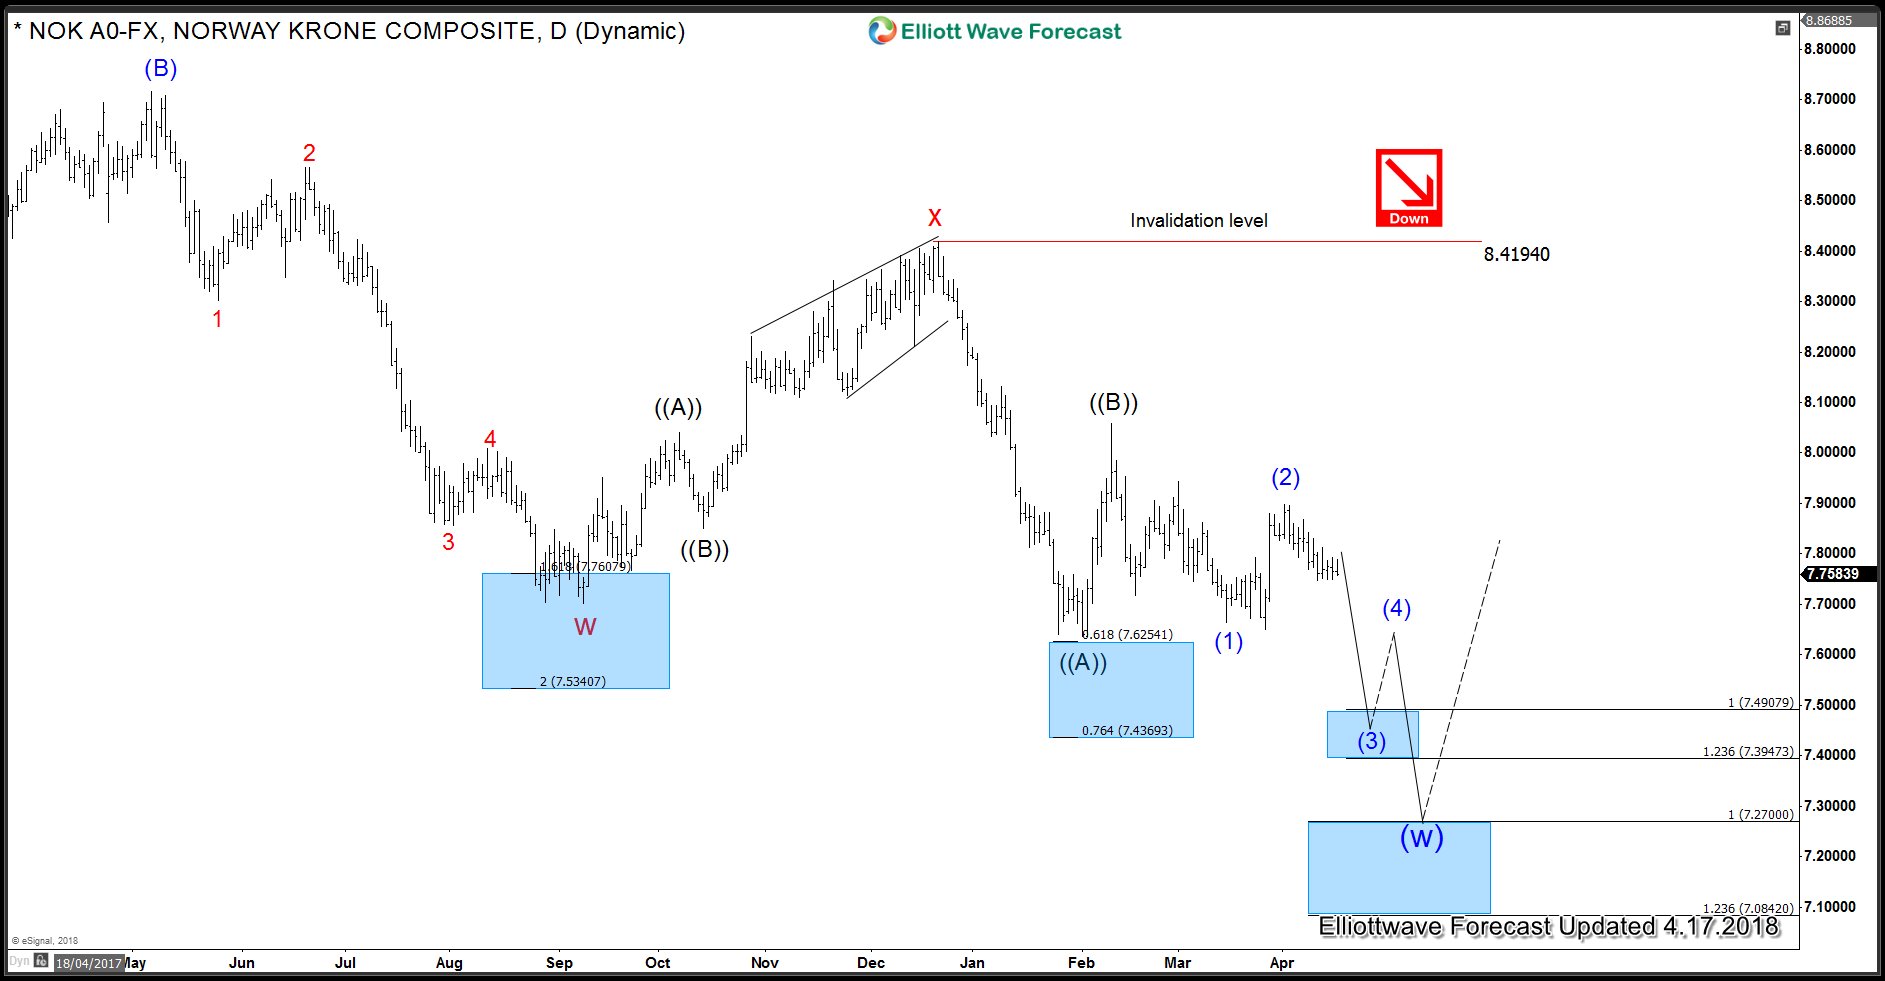
In this blog, we look at the swing sequence in USDNOK pair down from 1.6.2016 peak and explain the reason for selling the pair back in February 2018. USDNOK is showing 5 swings down from 1.6.2016 peak which is an incomplete bearish sequence and calls for USDNOK Q2 target to be lower. As shown on the daily chart, we are labelling the decline as a double three Elliott wave structure when wave “w” ended at 7.702 and wave “x” bounce ended at 8.4194. Down from there, we saw a decline in 5 waves which completed wave ((A)) at 7.637 and was followed by a bounce in wave ((B)) to 8.057. Pair has now resumed the decline and preferred Elliott wave view calls for the decline to extend lower towards 7.2755 – 7.1143 area. This area would complete a Zig-zag structure down from wave “x” peak at 8.4194 and a 7 swings Elliott wave sequence down from 1.6.2016 peak.
A break below 7.637 low is needed to confirm wave ((C)) lower has started towards USDNOK Q2 target. Until then a double correction in wave ((B)) towards 8.0736 – 8.1734 area can’t be ruled out but is not the preferred view. In either case, we don’t like the buying and like staying short and risk free from 8.0256 area looking lower towards USDNOK Q2 target area. A break of 7.637 low would initially expose 7.49 – 7.394 area which is 100 – 123.6 extension area of (1)-(2) and should complete wave (3) of ((C)). From there, we can expect a bounce in wave (4) to correct the decline from wave (2) peak at 7.898 for extension lower towards USDNOK Q2 target area between 7.2755 – 7.1143. Watch the video below in which we explained the swing sequence down from 1.6.2016 peak and the reason for selling the pair back in February 2018.


