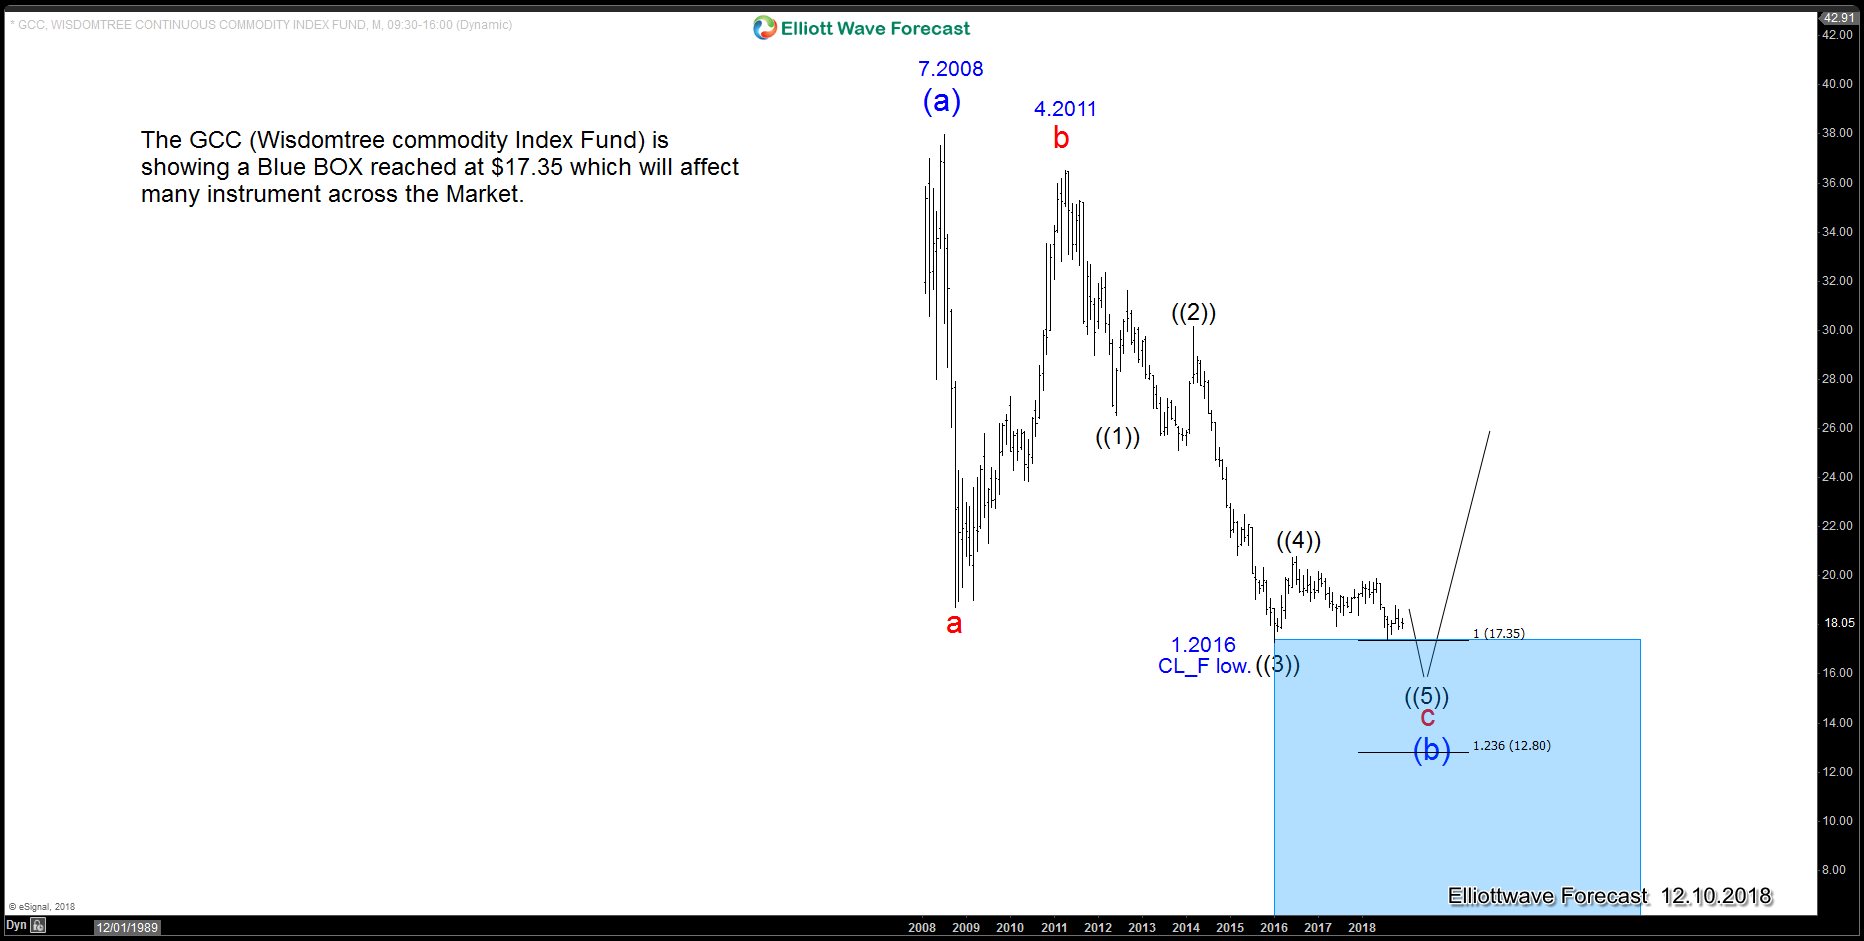
We at Elliottwave-Forecast.Com look at the Market as a whole and we keep track of many instrument to get an edge in the Market. At the end, nobody is 100% correct, but having an edge is the key for traders to help plan their upcoming trades. In this article, we look at the GCC (Wisdomtree Commodity Index Fund) which is showing a zig-zag structure within the Super cycle degree down from 7.2008 peak and it has reached the Blue box buying area which starts from 17.35. This structure and extension within the Blue Box will affect many instrument across the Market including $CL_F (OIL), $XAUUSD (GOLD), $XAGUSD (SILVER), $SPX and also $DXY.
GCC (Wisdomtree Commodity Index Fund) decline from 2008 peak
Chart above shows correction ending in the blue box and rally resuming for new highs above July 2008 peak which is the most aggressive view. There are alternative views and one of them is a bounce in a wave ((4)) when we are currently ending wave ((3)) and another low in wave ((5)) to complete wave c red. Either way, when we relate this to $USDCAD, it is easy to time a turn when the pair reaches its own Blue Box which will create either a strong rally in GCC and a strong sell off in $USDCAD or a bounce in wave ((4) and a 3 waves pull back in $USDCAD. In either case, a reaction higher should take place soon in GCC.
In the following video, we explained the count in GCC and we overlaid it with $USDCAD and $CL_F. We explained why we see this dip in $CL_F as a buying opportunity and how see the downside to be limited in $CL_F so finding and analyzing GCC provides us with the edge and tells us not to get aggressively short $CL_F and rather wait for the perfect timing to look for a buying opportunity in $CL_F again.
Back


