Netlist Inc. is a designer and manufacturer of high-performance SSDs, modular memory subsystems and legacy memory products. Netlist holds a portfolio of patents in the areas of server memory, hybrid memory, storage class memory, rank multiplication and load reduction. The products are sold to enterprise and appliance customers, system builders and cloud and datacenter customers. Founded 2000, it is headquartered in Irvine, California, US. Investors can trade it today under the ticker $NLST on OTCQB.
Netlist Monthly Elliott Wave Analysis 01.09.2023
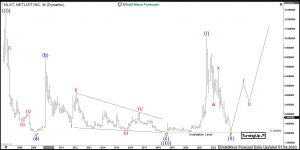
The monthly chart below shows the Netlist shares $NLST traded on OTCQB. From the IPO in 2006, the stock price has developed an initial cycle higher in black wave ((I)) of grand super cycle degree towards 12.64 all-time highs in January 2007. Then, a correction lower in black wave ((II)) has unfolded as an Elliott wave zigzag pattern being 5-3-5 structure.
Firstly, impulse in blue wave (a) of black wave ((II)) has printed a low at 0.1112 in March 2009. Then, a bounce has set a connector wave (b) at 7.98 highs in November of the same year. Later on, the price has broken 0.1112 lows opening up a bearish sequence. As a consequence, blue wave (c) should have extended lower. However, since the price can not go below zero, there is a lack of space to the downside. The diagonal in blue wave (c) has found its bottom in August 2018 at $0.10. While above the lows, a new bullish cycle in black wave ((III)) might have started. The target for the wave ((III)) is 12.76-20.59 area and even beyond.
Within the black wave ((III)), one can see an initial nest consisting of blue waves (I)-(II) in formation. From August 2018 lows, an impulse in blue wave (I) has found its peak in July 2021 at $10.20. From there, a consolidation in blue wave (II) is currently taking place. Investors and traders can use it, to enter the market for an acceleration higher in blue wave (III) of black wave ((III)).
Netlist Daily Elliott Wave Analysis 01.09.2023
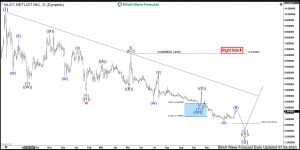
The daily chart below shows in more detail the correction within wave (II) in more detail. From the July 2021 highs $10.20, it unfolds as a double three pattern. Firstly, from the July 2021 highs, a double 3 structure in red wave x has set a low in January 2022 at 3.25. Secondly, a bounce in red wave x has printed a connector high in May 2022 at 6.65. Thirdly, the price has broken the 3.25 lows opening up a bearish sequence. Now, red wave y has been confirmed and should see more downside. However, again we see limitations of space which do not allow $NLST to extend full 100% to the downside.
Within red wave y, the black wave ((W)) has reached 0.618-0.786 extension being 2.36-1.19 area. Then, Netlist saw a bounce in black wave ((X)) which has failed below May 2022 peak. Now. possibly final push lower in black wave ((Y)) of red wave y may reach 0.618-0.786 extension of the black wave ((W)) being 0.67-0.10 area. Indeed, breaking $0.10 would mean that the nest from 2018 will become invalidated.
Investors and traders can be looking to buy $NLST against $0.10 low using the pressure of the bearish sequence for lower prices on the one hand and the lack of space for the price drop on the other hand to enter the technology stock of Netlist.
Netlist Video Elliott Wave Analysis 01.09.2023
Let us discuss in a video the cycles, the wave structure, the sequences and real investment opportunities in the stock price action of the technology company Netlist ($NLST).
Get more insights about Stocks and ETFs by trying out our services 14 days . You’ll learn how to trade the market in the right side using the 3, 7 or 11 swings sequence. You will get access to our 78 instruments updated in 4 different time frames, Live Trading & Analysis Session done by our Expert Analysts every day, 24-hour chat room support and much more.
Back


