The last time I covered Chevron was in May 20201 where I was expecting a pullback against the October 2020 low to take place. You can view this article here. Lets take a look at the chart from May 2021:
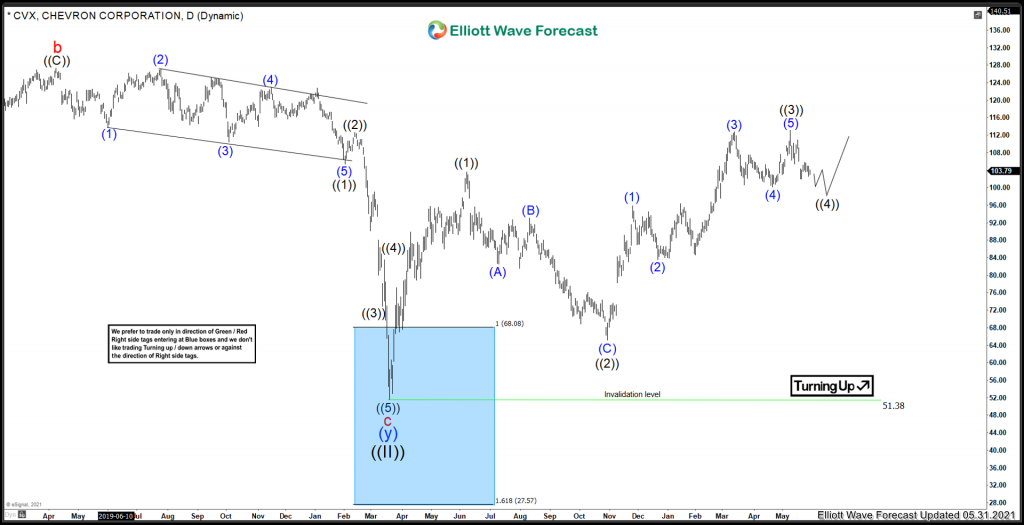
Chevron Elliottwave View May 2021:
At the time I was looking for further downside to take place. The correction in ((4)) took a bit longer than expected. However, the structure remains intact. Chevron has corrected the October 2021 cycle and has started the next leg higher. Lets take a look at the current chart.
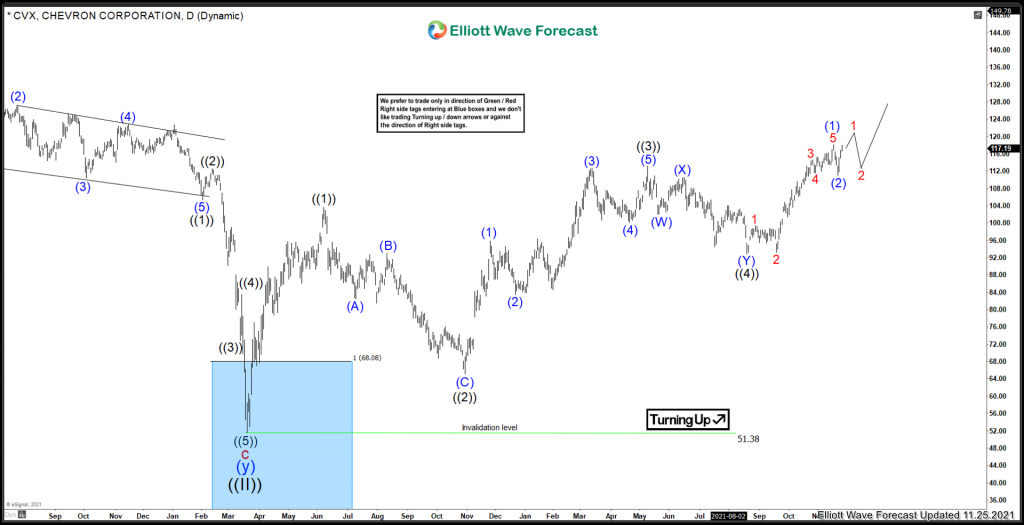
Chevron Elliottwave View November 2021 view:
Since the May 2021 low, the count is looking very bullish. Recently, the instrument is favoured to have completed the pullback against the August 2021 low. Chevron showing 5 waves higher into the 11/16 peak. It has not yet taken that peak in price, however that is favoured to take place within the weeks to come. There is further upside potential to take place in the energy sector, we do not like to sell this sector, only look for the buying opportunities in 3, 7 or 11 swing at the blue boxes where buyers can enter.
Risk Management
Using proper risk management is absolutely essential when trading or investing in a volatile stocks. Elliott Wave counts can evolve quickly, be sure to have your stops in and define your risk when trading.
Improve your trading success and master Elliott Wave like a pro with our 14 day trial today. Get free Elliott Wave Analysis on over 70 instruments. Including stocks like GOOGL, TSLA, AAPL, FB, MSFT and many many more.
Back

