Hello fellow traders. In this article we’re going to take a quick look at the Elliott Wave charts of USDCAD, published in members area of the website.As our members know, we have favoring the long side in the pair . Recently the pair made a pull back that has given us buying opportunities. We recommended members to avoid selling the pair, while keep favoring the long side. In the further text we are going to explain the Elliott Wave Forecast and trading strategy.
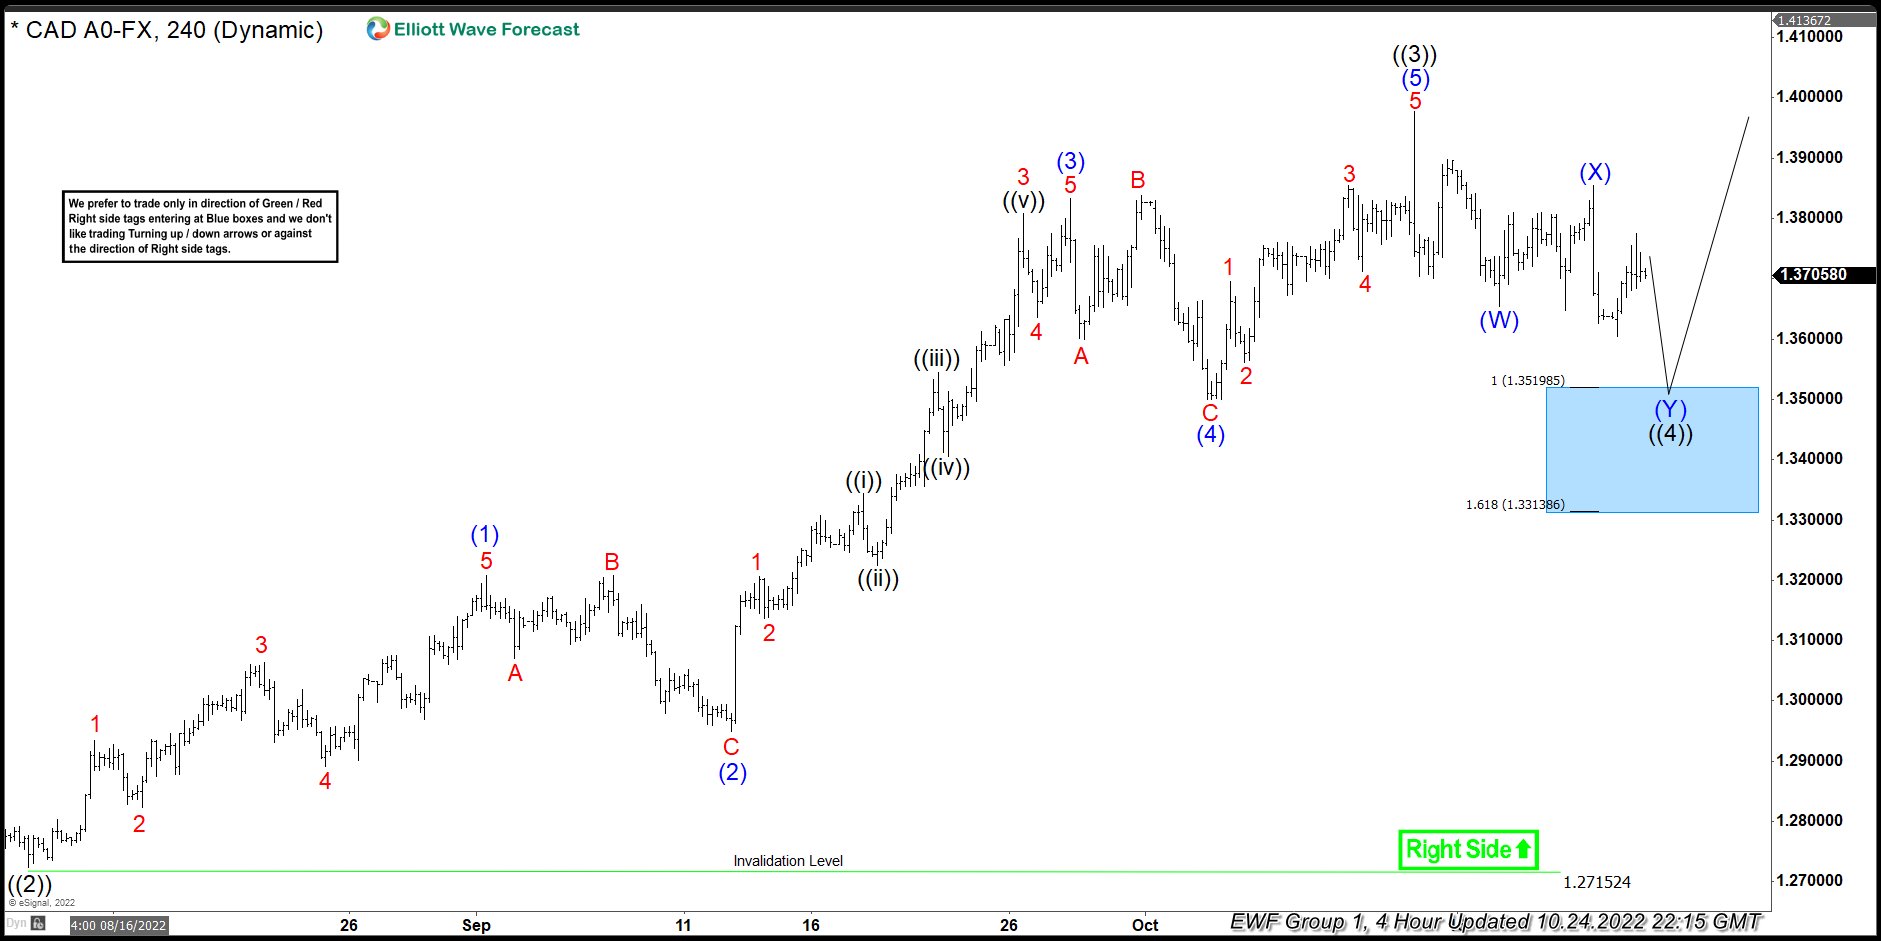
USDCAD Elliott Wave 4 Hour Chart 10.24.2022
The pair is giving us wave ((4)) pull back against the the 1.2715 low. Correction looks incomplete at the moment, showing lower low sequences from the peak that suggests we should ideally see more downside toward 1.3519-1.3313 ( buying zone) . We don’t recommend selling the pair against the main bullish trend. Strategy is waiting for the price to reach blue box zone, before entering the long trades. Buyers should appear at the blue box for the further rally toward new high ideally or for a 3 waves bounce at least . Invalidation for the long trades is break of 1.618 fib ext : 1.3313
Quick reminder:
Our charts are easy to trade and understand:
Red bearish stamp+ blue box = Selling Setup
Green bullish stamp+ blue box = Buying Setup
Charts with Black stamps are not tradable. 🚫
You can learn more about Elliott Wave Patterns at our Free Elliott Wave Educational Web Page.
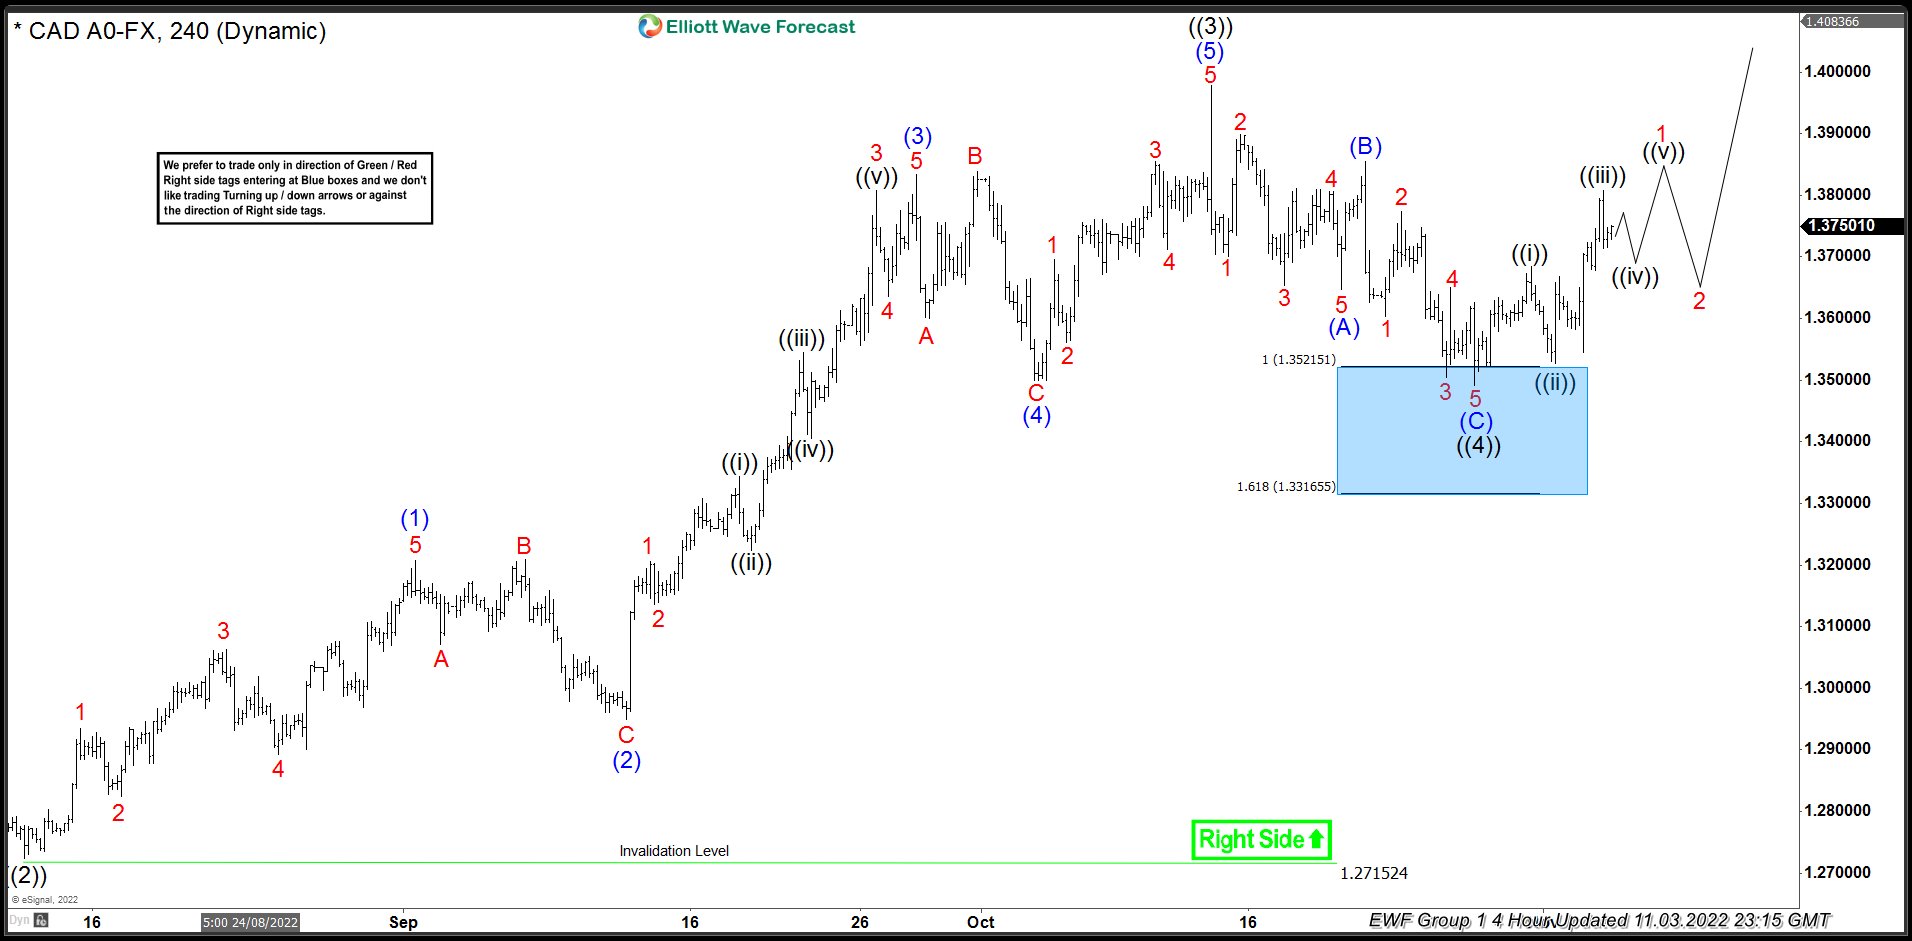
USDCAD Elliott Wave 4 Hour Chart 11.03.2022
USDCAD has given us more downside toward marked area expected. The pair found buyers at the 1.3519-1.3313 ( Blue Box – buying zone) and we are getting good reaction from there. As a result , all long trades are risk free (put SL at BE) + partial profits have been taken. Wave ((4)) black pull back has ended at 1.3492 low. That is the key level to hold for proposed view. As far as the price above that level, next leg up could be in progress toward new highs. In near term we expect to see pull back which will be either ((iv)) or correction against the 1.3492 low. However if pivot at 1.3492 low gives up, we still can see double in ((4)) toward 1.3321-1.3019 area, next zone for buyers.
Keep in mind that market is dynamic and presented view could have changed in the mean time. You can check most recent charts in the membership area of the site. Best instruments to trade are those having incomplete bullish or bearish swings sequences. We put them in Sequence Report and best among them are shown in the Live Trading Room
Elliott Wave Forecast
We cover 78 instruments in total, but it’s important to keep in mind that not every chart is trading recommendation. We present Official Trading Recommendations in Live Trading Room. If not a member yet, Sign Up for 14 days Trial now and get access to new trading opportunities. Through time we have developed a very respectable trading strategy which defines Entry, Stop Loss and Take Profit levels with high accuracy.
Please keep in mind that we don’t make the market and our forecasts don’t have 100% accuracy. However, we do have a system which allows us to get out Risk Free + cash partial profit from the trade, even if primary analysis gets wrong. Join us now and start learning from market experts. If you are looking for professional real-time analysis in Forex, Indices, commodities,Crypto currencies , stocks and ETFs you have come to the right place.
Welcome to Elliott Wave Forecast !


