Traders, usually, have been told that Price is the most important aspect of the trading dynamic. We have been told to look at the charts all day and follow every swing the Market does, sometimes even dropping down to the 1 minute chart and using a range of indicators to try and decode the price action. The reality is that Price is the less important part of trading. Most wavers use the Elliott wave Principal to only look at price and consequently the Theory, which is a great discovery, finds itself subjective and always presenting more than 1 paths. The reality is that, we at Elliottwave-Forecast, are always trying to find ways to determine the path that makes more sense and the path which is supported not only through Elliottwave Theory, but also with some new aspect of trading. We have developed what we called the Distribution of the Market. The PRICE is always moving in the Market, but not always moves the same ways and neither at the same speed or with the same distribution. An instrument can move 100 points at 2 different occasions and even though it moved the same distance in price at both occasions, the effect of the move on the cycles and hence the market could be different on both occasions. We have gathered a series of tools which were not available in 1930’s when the Theory was discovered. We developed a math system in the Market based in the speed against the time and that shows when cycles end in different time frames. Then it come the Time aspect of the Market, In Elliott wave Theory, corrections should be comparable in time. Usually ,we see wave 2 lasting same amount of time as wave 4 or we see a wave X in a WXY lasting the same amount of time as that of a wave X in a lesser degree. We at Elliottwave-Forecast combine and look at every aspect of the trading and we draw the ideas based more in Time and Distributions than price or Elliott wave sequences.
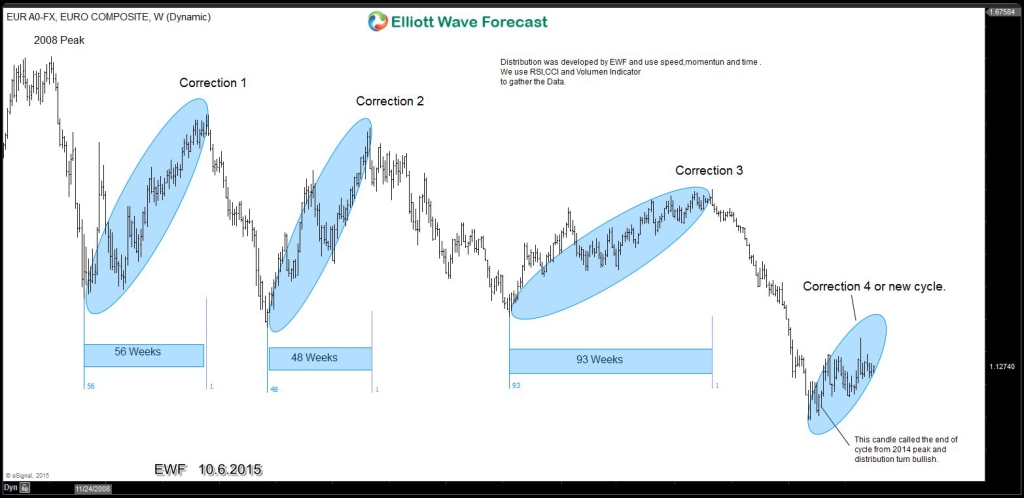
The chart below shows how the EURUSD from the peak in 2008, shows 4 major corrections against the bearish cycle and see how each corrections in time was comparable to the other, lasting more or less the same amount of time. We knew in early April 2015, that the cycle from peak of correction 3 ended and the price will be supported because of the time factor. That meant price would go higher or stay sideways spending more time in the correction if pair were to make another low. Either way, we think correction 4 or new cycle ideally would need around 50 weeks and the price should remain sideways – supported until then as we explained in this Interview with Dale Pinkert in May, 2015 Interview as well. We hope you enjoyed reading this blog and if you would like to learn more about how we do things at EWF, take the Free Trial with Elliottwave-Forecast
Back
