
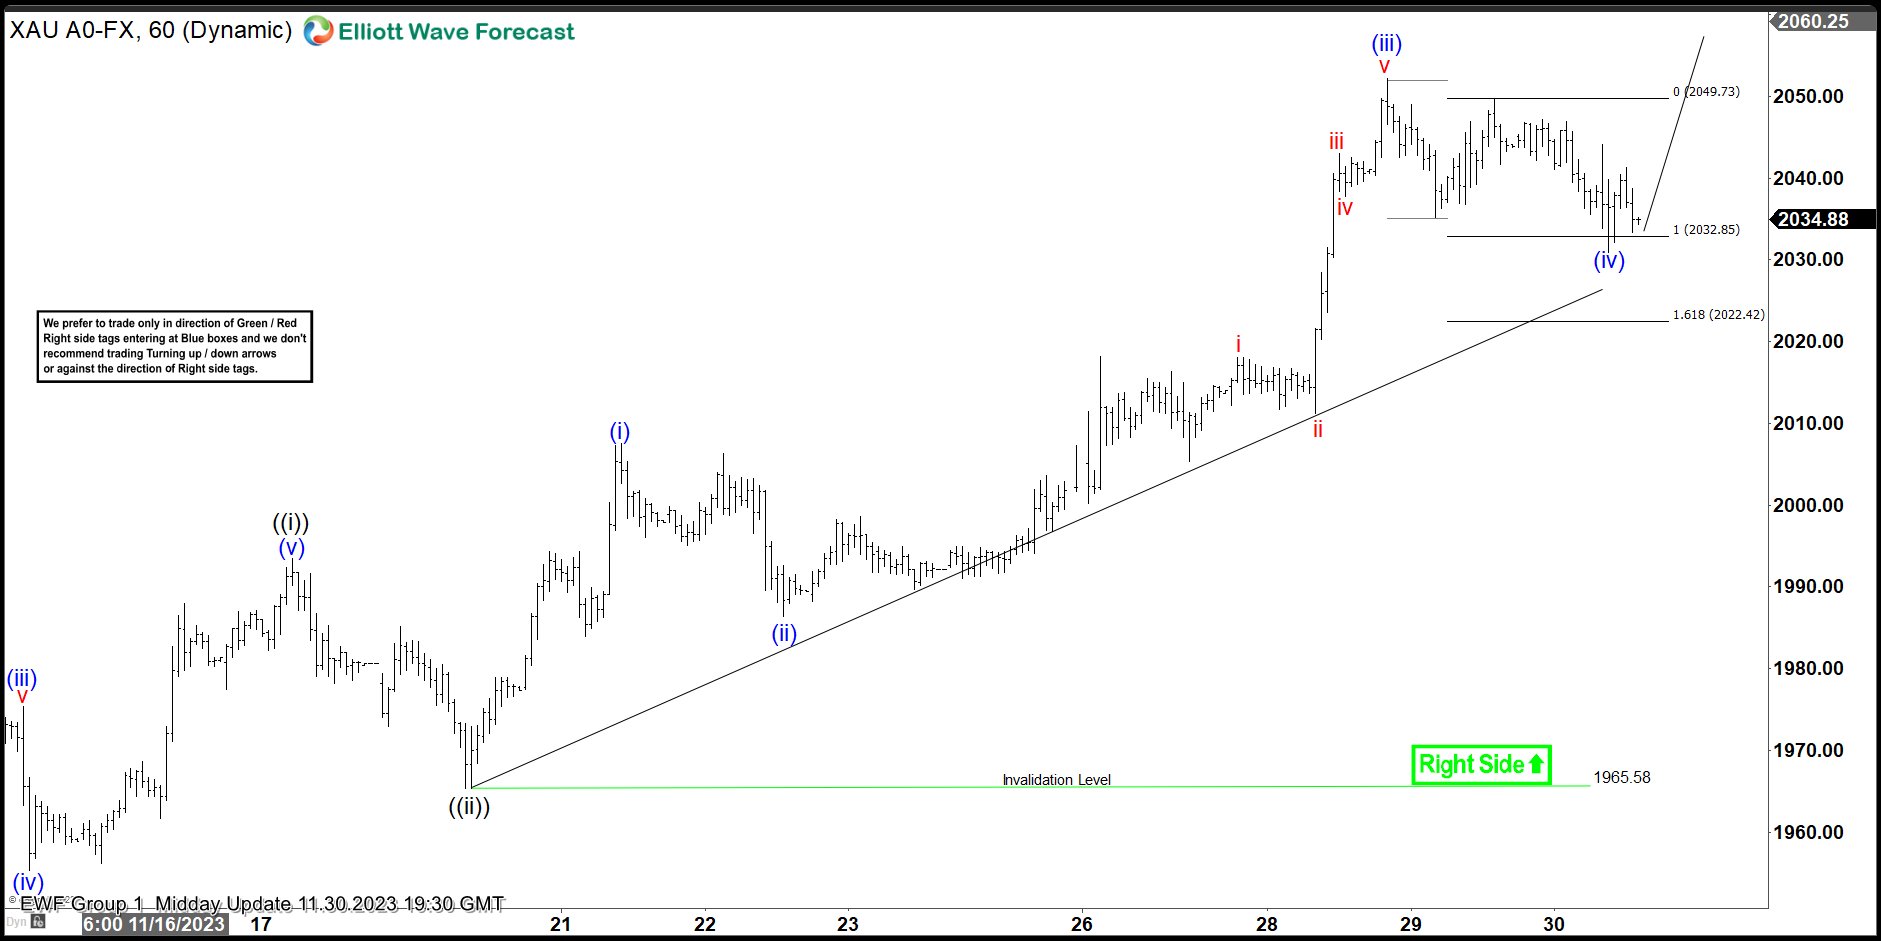
Last year, our live trading room provides 69% return annually across the 3 groups that we cover. In Live Trading Room, we scan the market everyday to find any tradable setup. We believe every serious traders need to have a good trading system with specific rules. A complete system must include the following: 1. Conditions […]
-
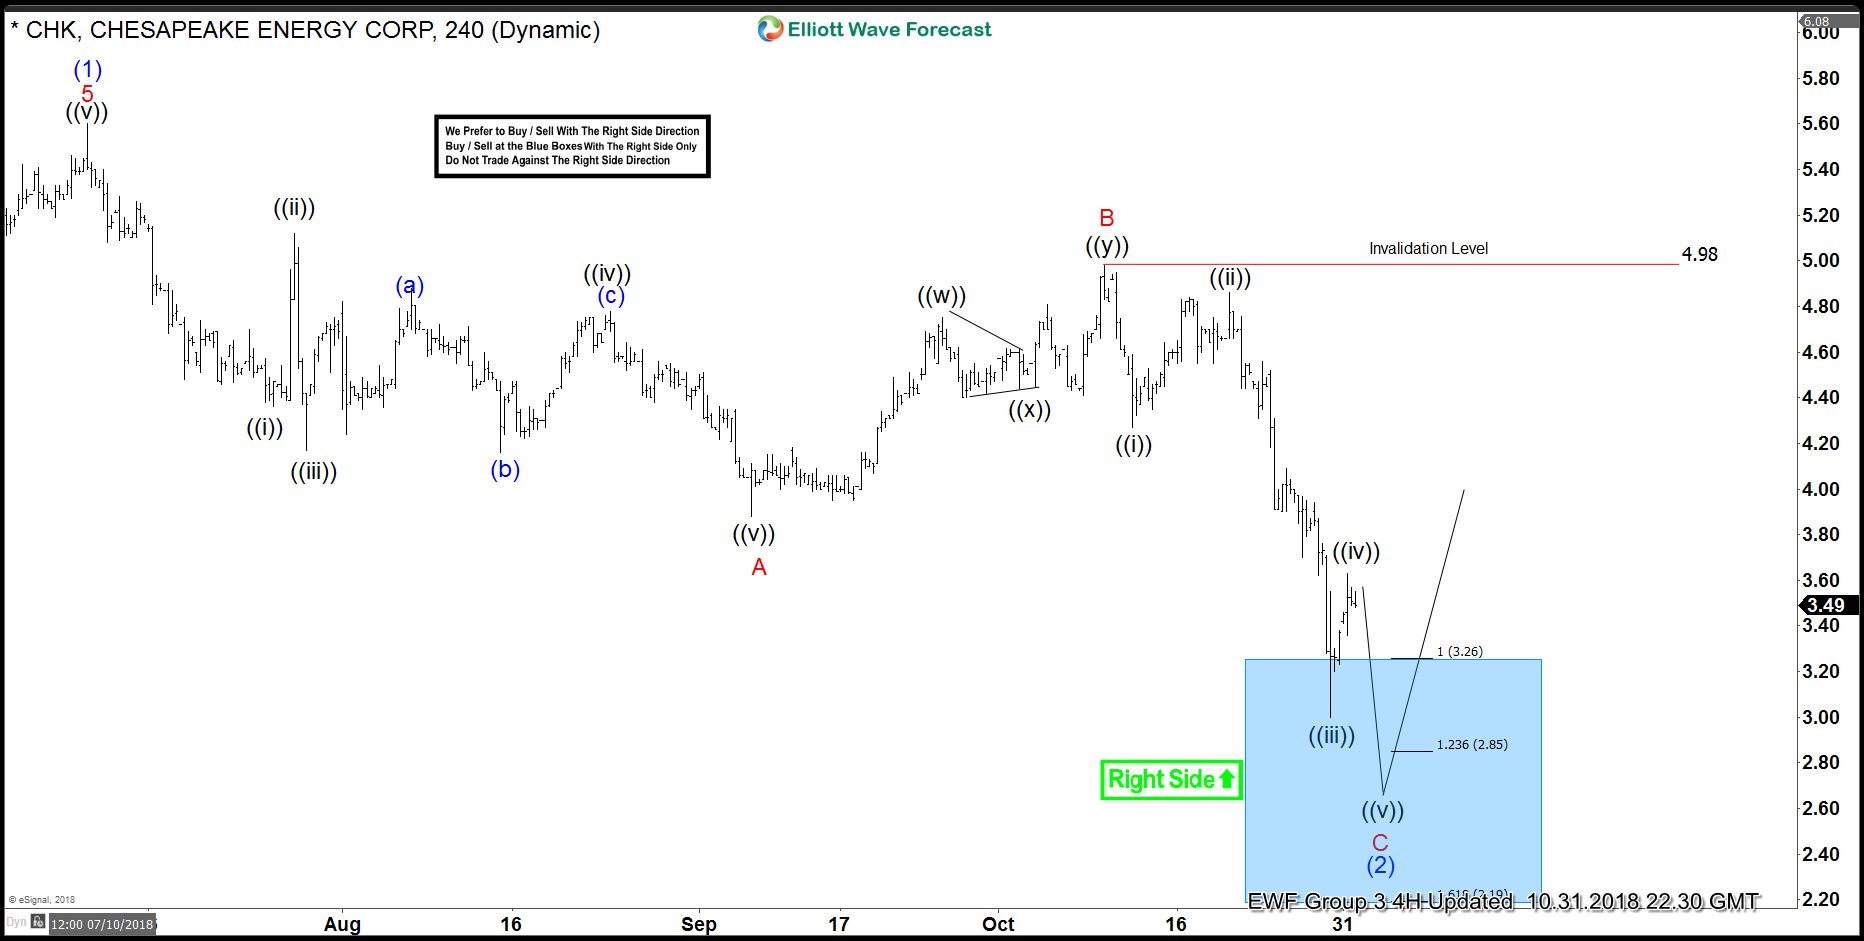
Why We Are Buying CHK Again
Read MoreAfter just getting stopped out in CHK for no loss, why are we buying again? I am of the firm belief that if you only traded based on the media drive-by observations of any particular stock you would be hard pressed to know what to do most of the time. For example, how many times […]
-
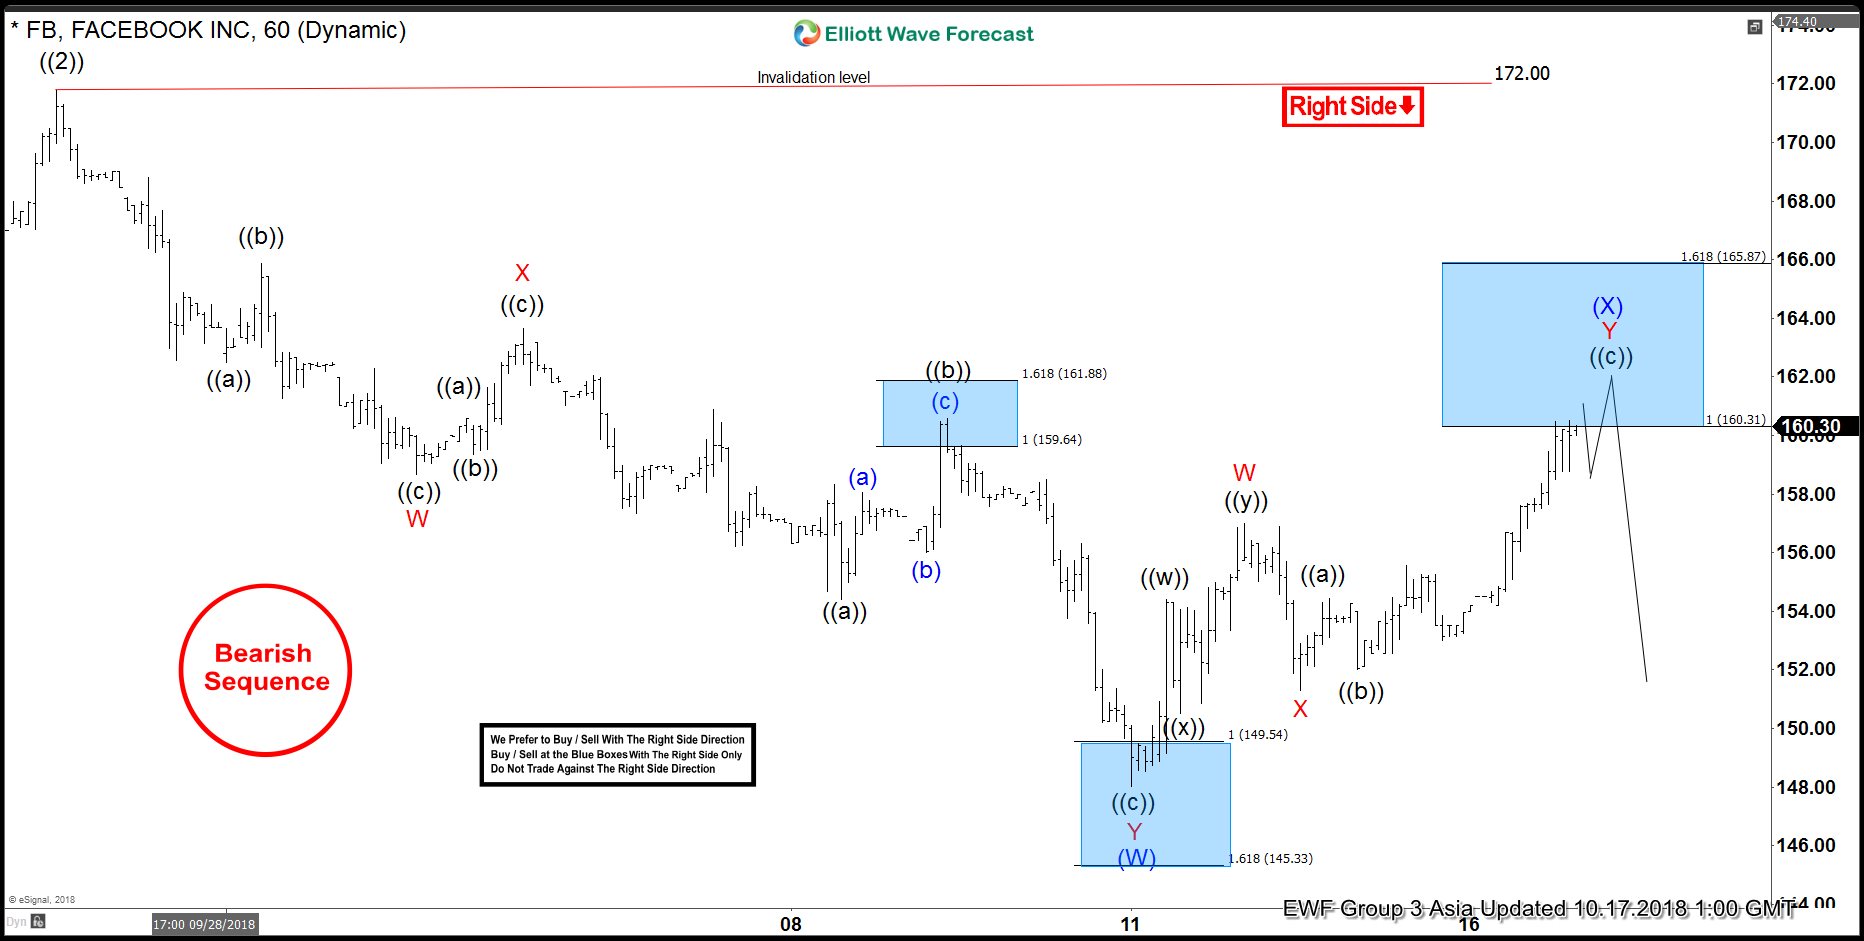
Facebook Forecasting The Decline & Selling The Rallies
Read MoreHello fellow traders. In this technical blog we’re going to take a quick look at the charts of Facebook. As our members know, early in October, Facebook has incomplete sequences in the cycle from the July 2018 peak. The Stock was still missing another swing down to complete proposed pattern. Consequently , we expected Facebook […]
-
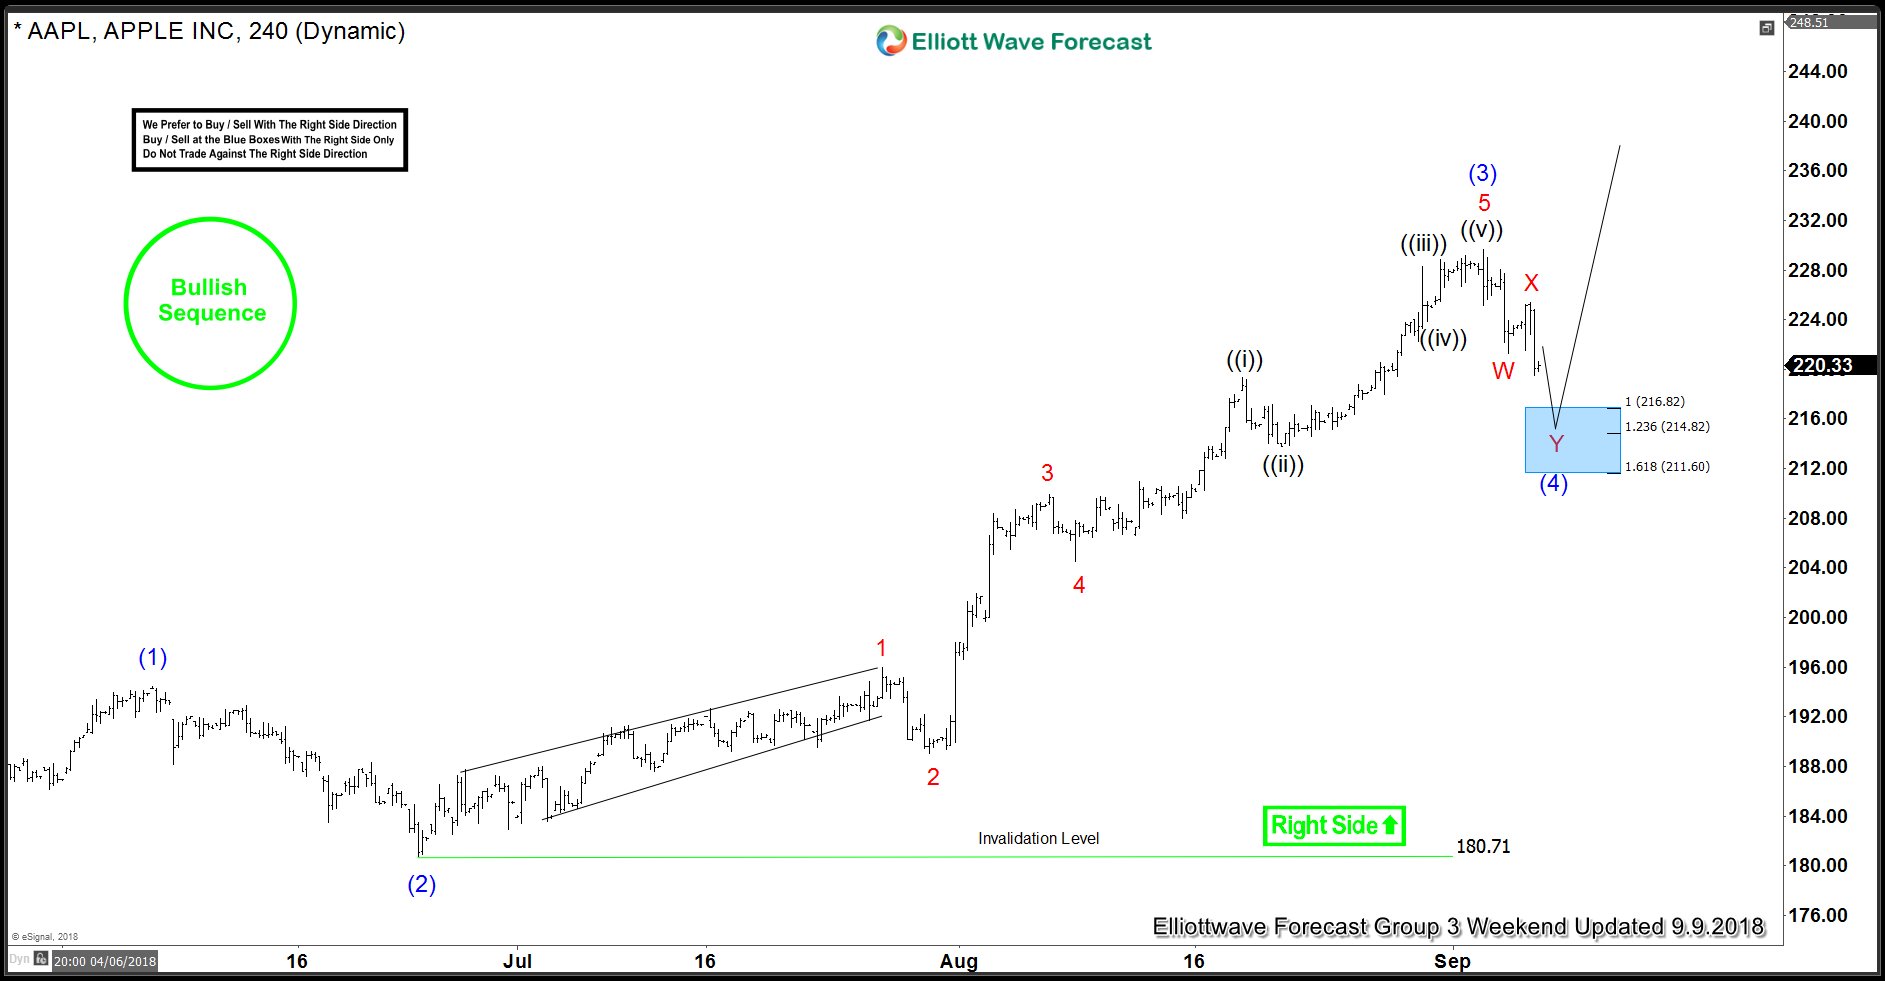
AAPL: Trading The Right Side using Elliott Wave Theory
Read MoreIn this blog, AAPL has been in a strong up trend with right side up in all time frames. We have developed a Right Side system which combines Elliott Wave, Cycles and Sequences and consists of Right side up, Right side down, turning up and turning down arrows. We only trade in direction of the Right […]
-
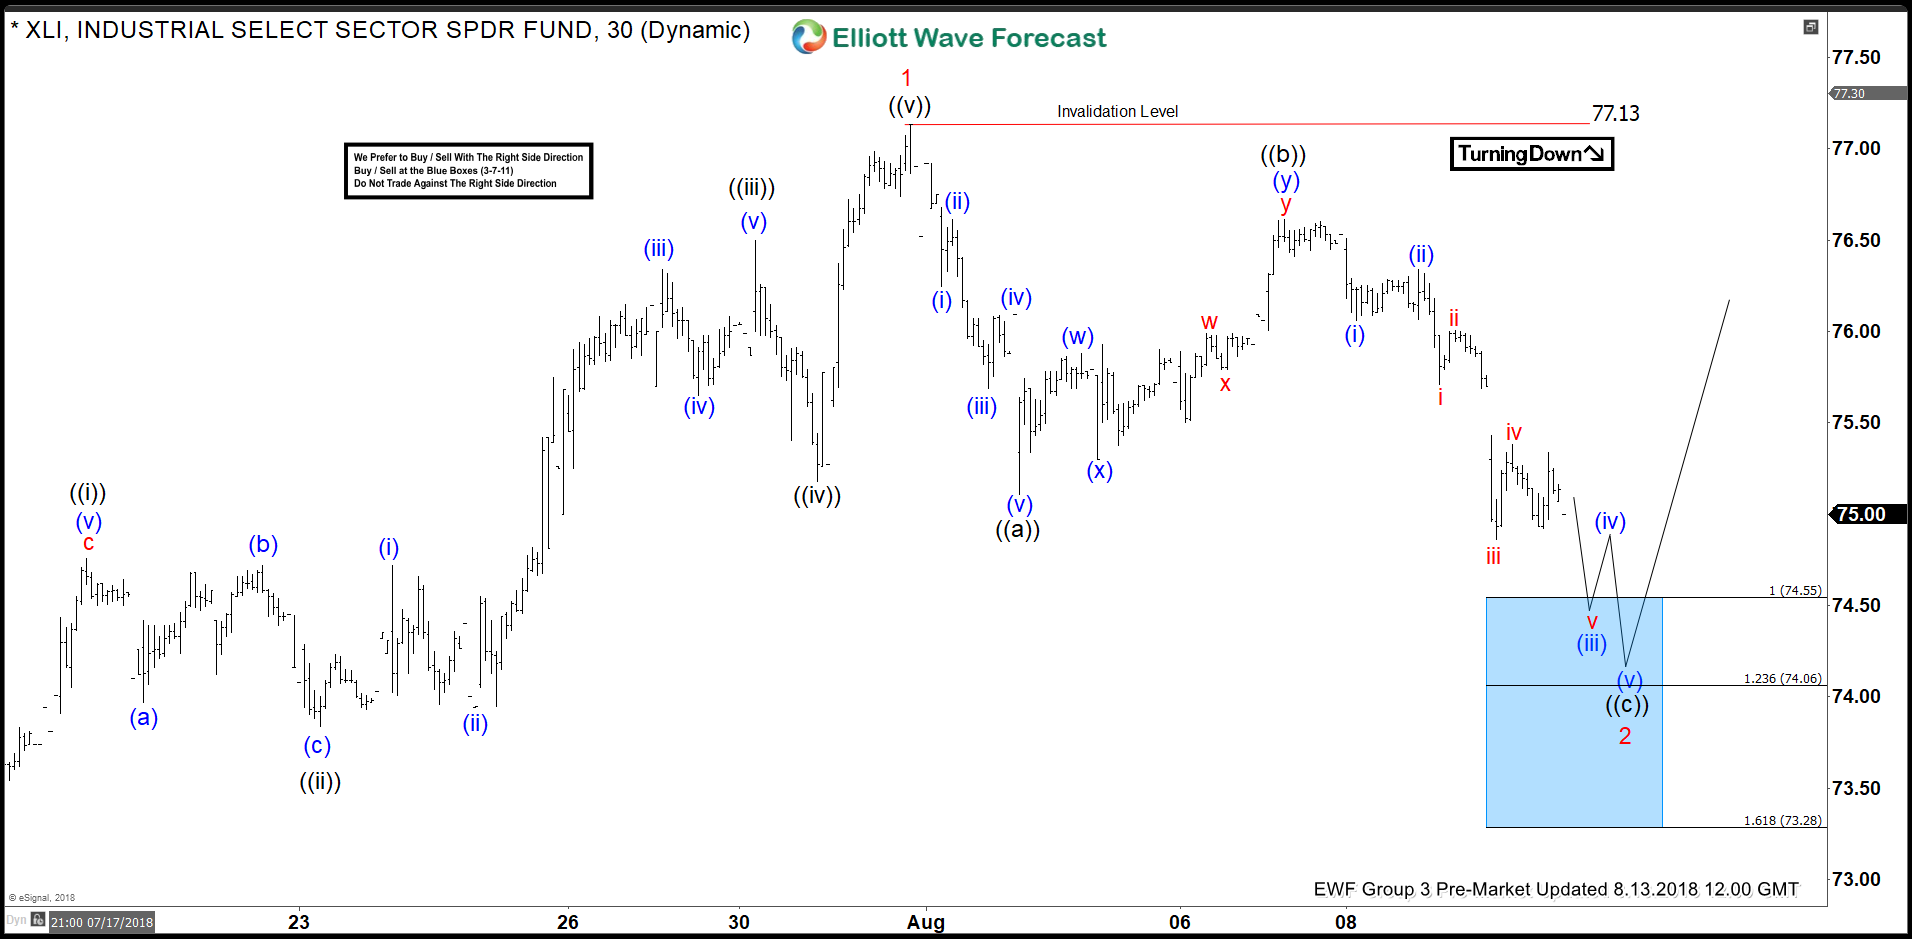
XLI Elliott Wave Analysis: Inflection Area Called The Rally
Read MoreHello fellow traders. In this blog, we will have a look at some past Elliott Wave charts of the Industrial Select Sector (XLI) which we presented to our members in the past. Below, you see the 1-hour updated chart presented to our clients on the 08/13/18 showing that XLI ended the cycle from 06/27 low in red wave 1. As […]
-
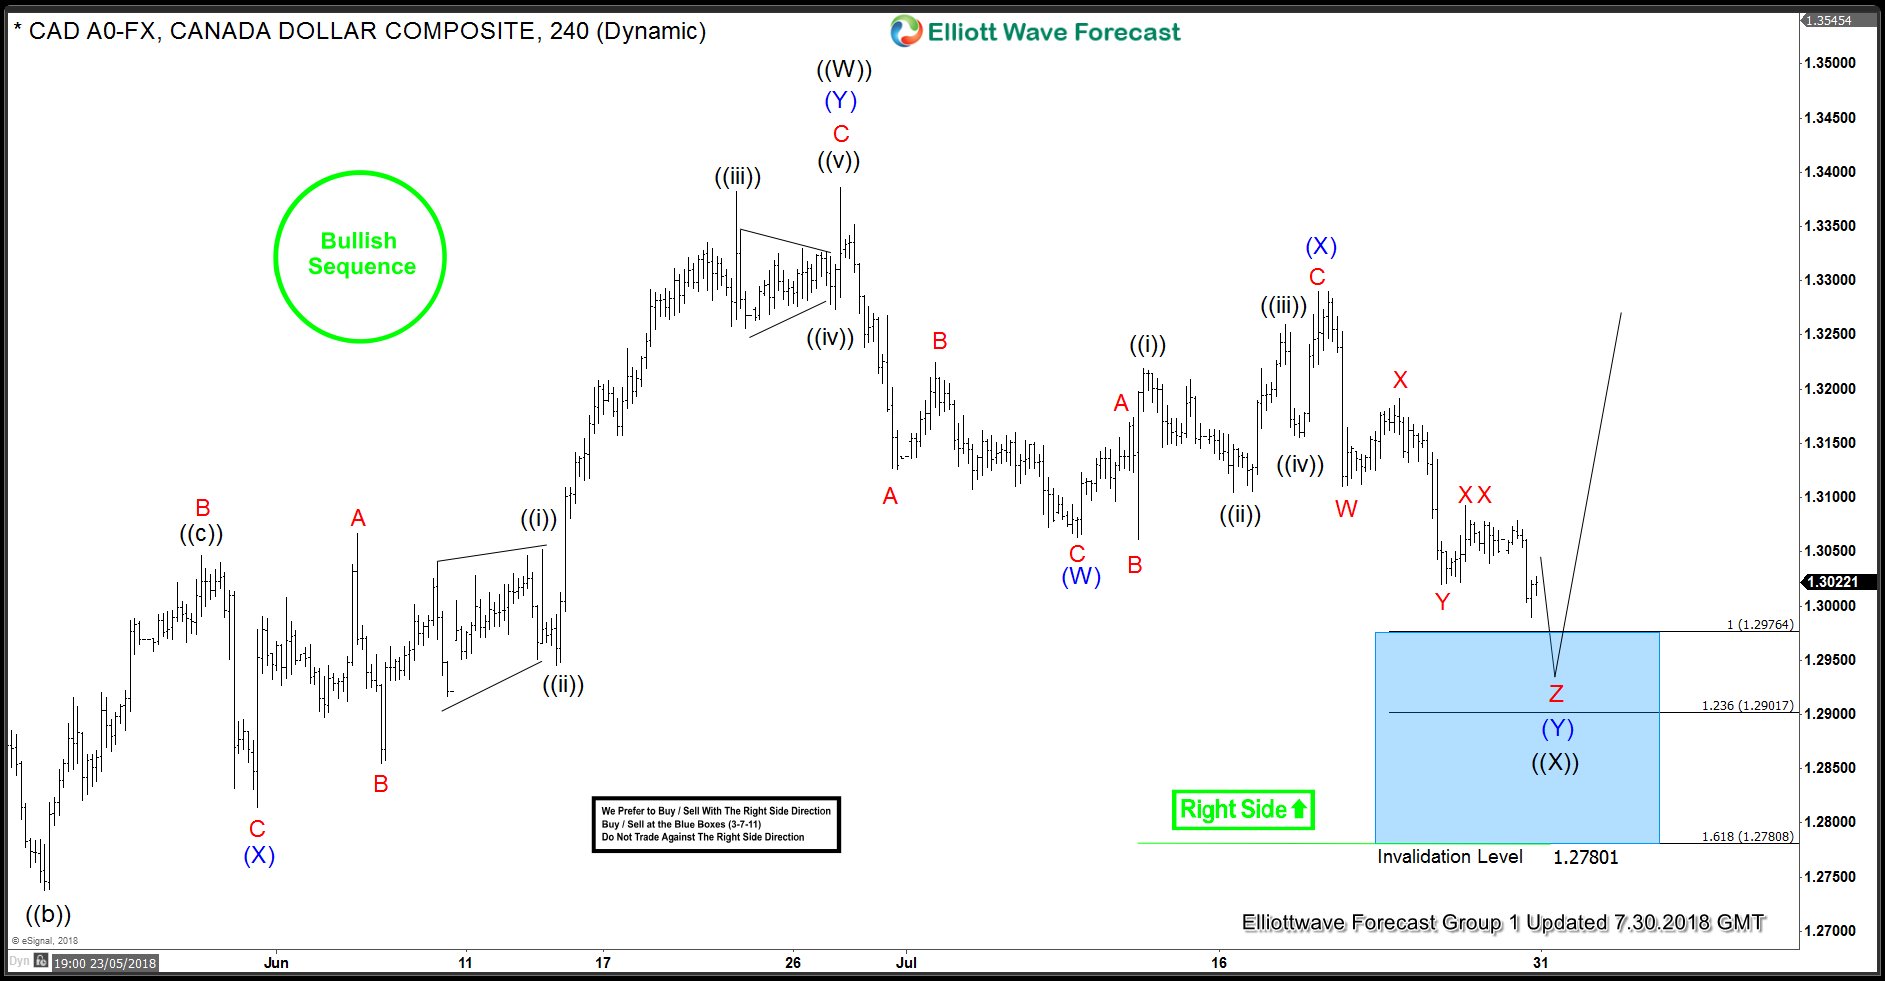
USDCAD: Found Buyers in Blue Box and Rallied
Read MoreHello fellow traders. Another trading opportunity we have had lately is USDCAD. In this technical blog we’re going to take a quick look at the Elliott Wave charts of USDCAD published in members area of the website. As our members and followers know, this pair has incomplete bullish sequences in the cycle from the September […]
-
Market Nature And The Art Of Trading It
Read MoreNature, in the broadest sense, is the natural, physical, or material world or universe. “Nature” can refer to the phenomena of the physical world, and also to life in general. The study of nature is a large, if not the only, part of science. Although humans are part of nature, human activity is often understood […]