
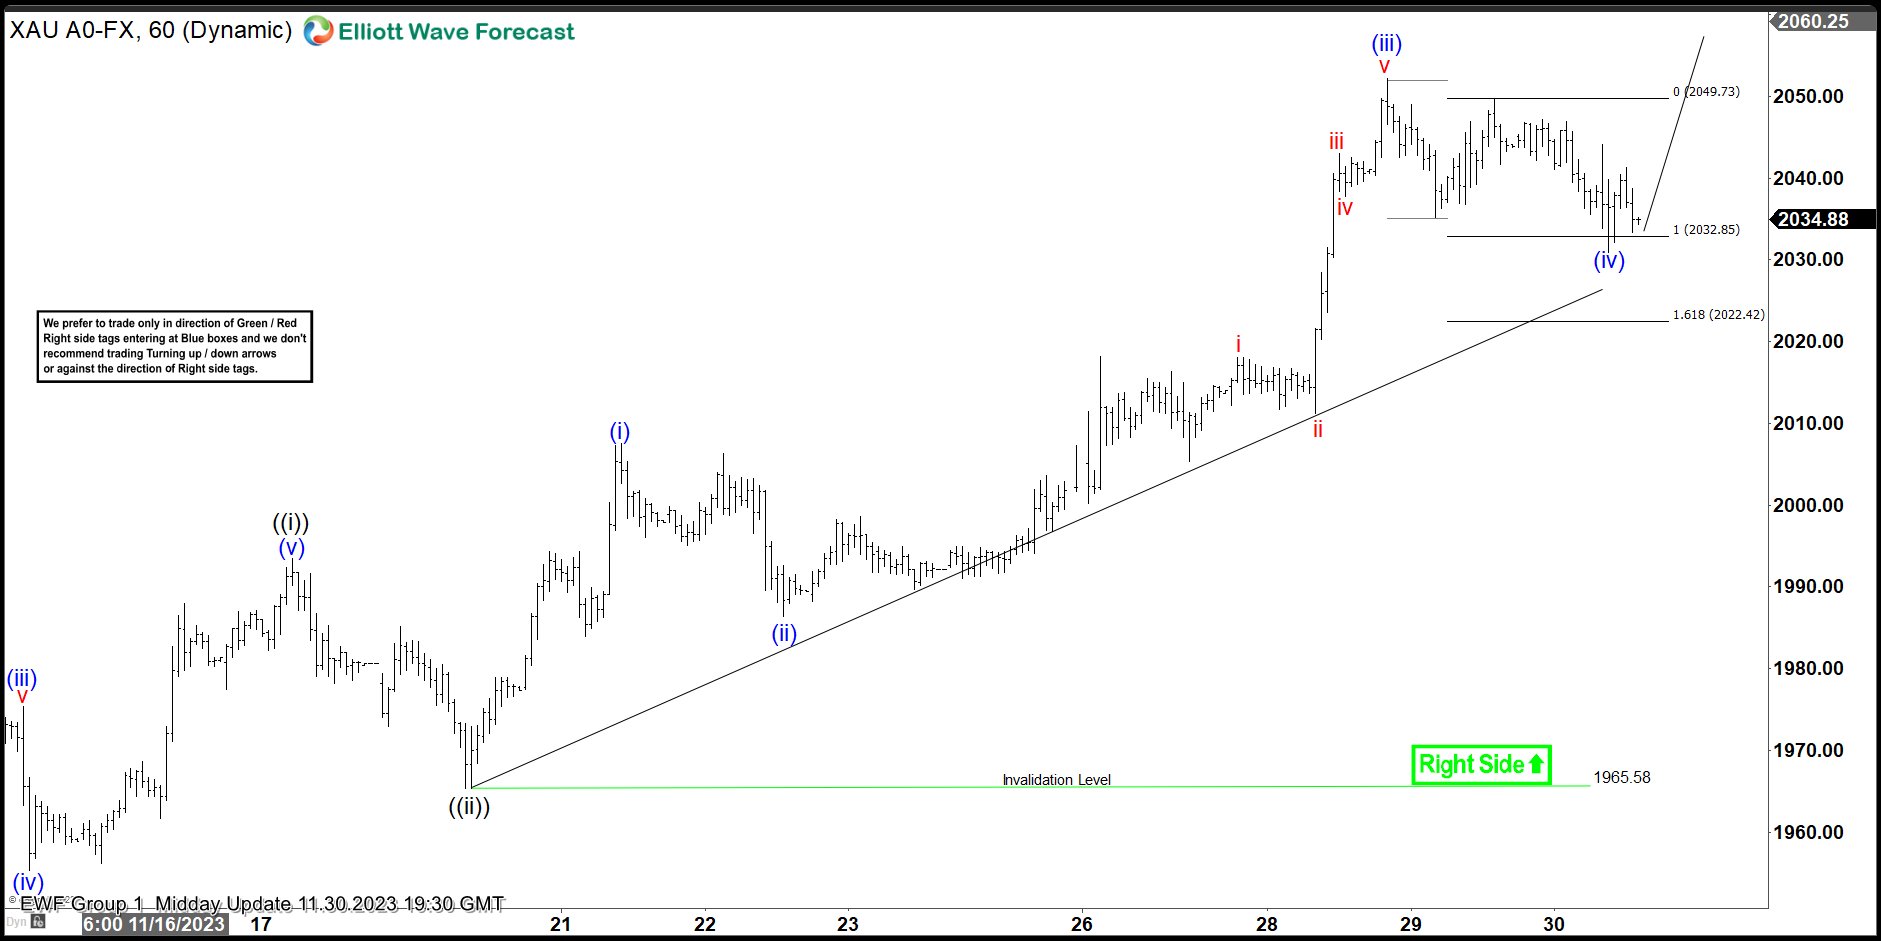
Last year, our live trading room provides 69% return annually across the 3 groups that we cover. In Live Trading Room, we scan the market everyday to find any tradable setup. We believe every serious traders need to have a good trading system with specific rules. A complete system must include the following: 1. Conditions […]
-
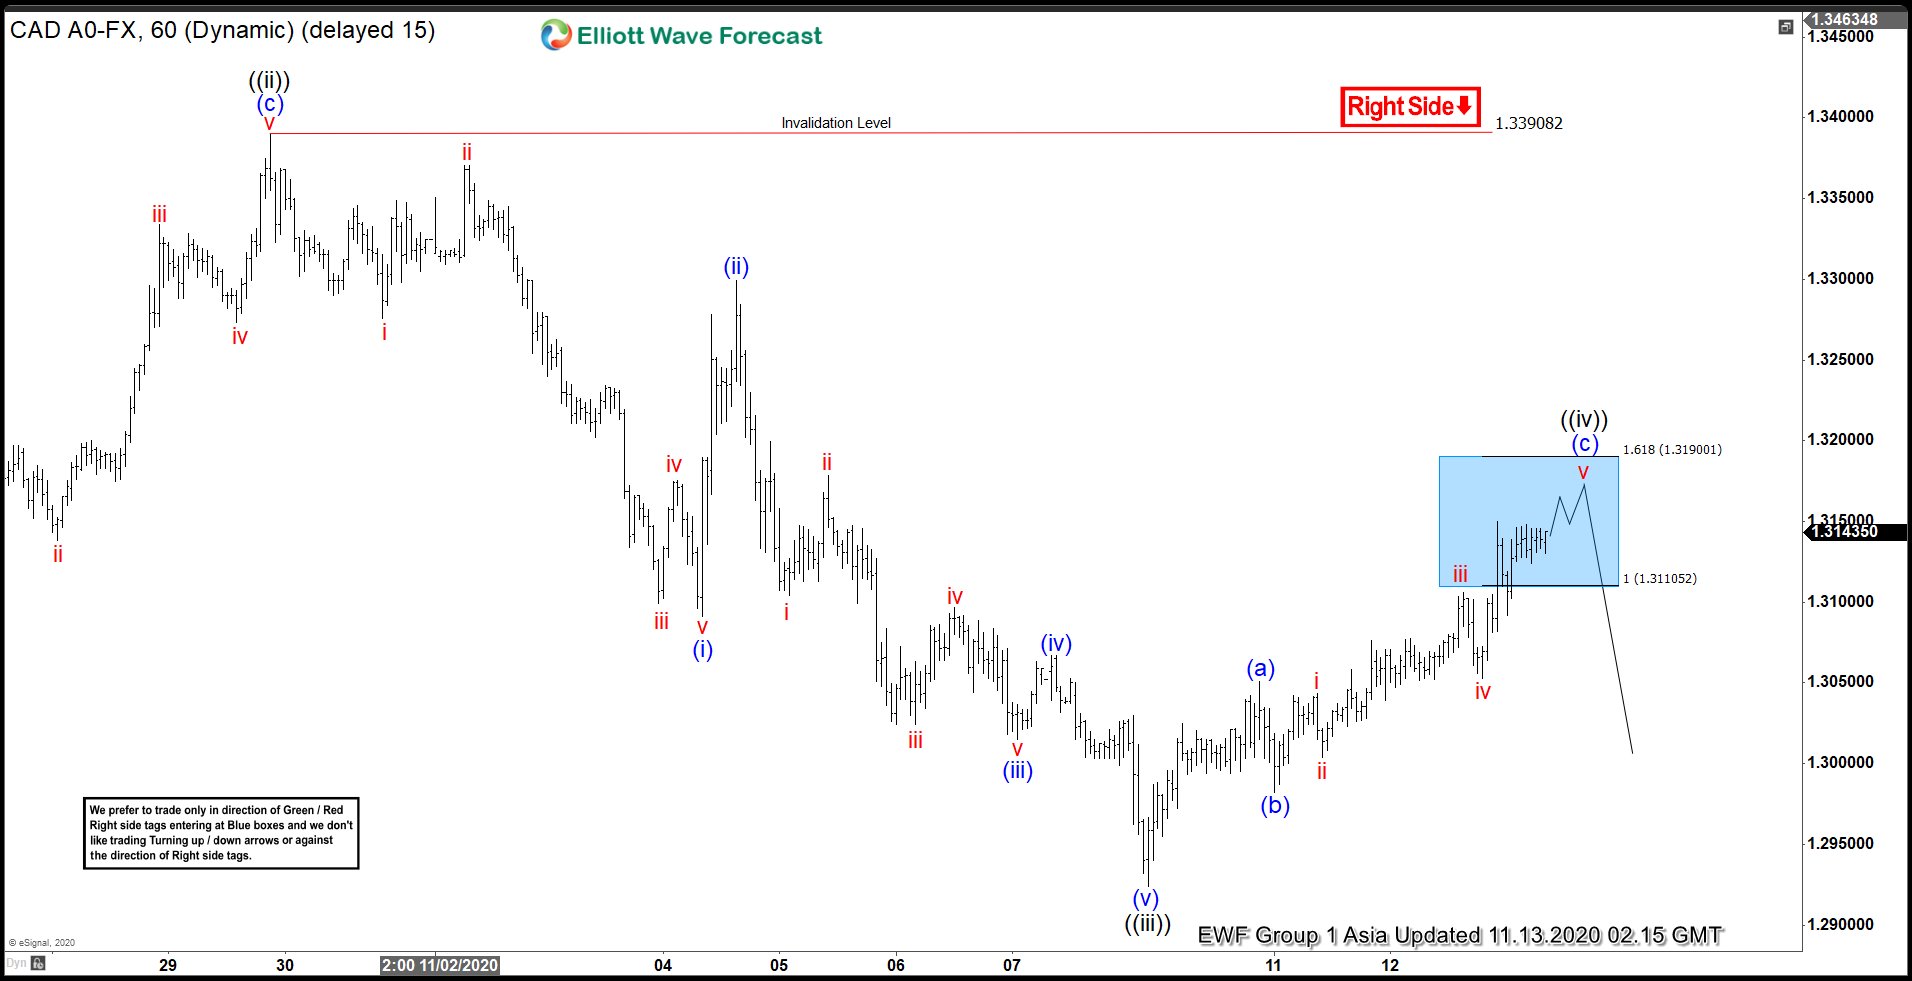
USDCAD Turned Lower From The Blue Box ( Sellers Zone)
Read MoreHello fellow traders. In this technical blog we’re going to take a quick look at the charts of USDCAD published in members area of the website. As our members know, USDCAD is showing lower low sequences in the cycle from the 03/19 peak . We advised clients to avoid buying the pair ,while favoring selling […]
-
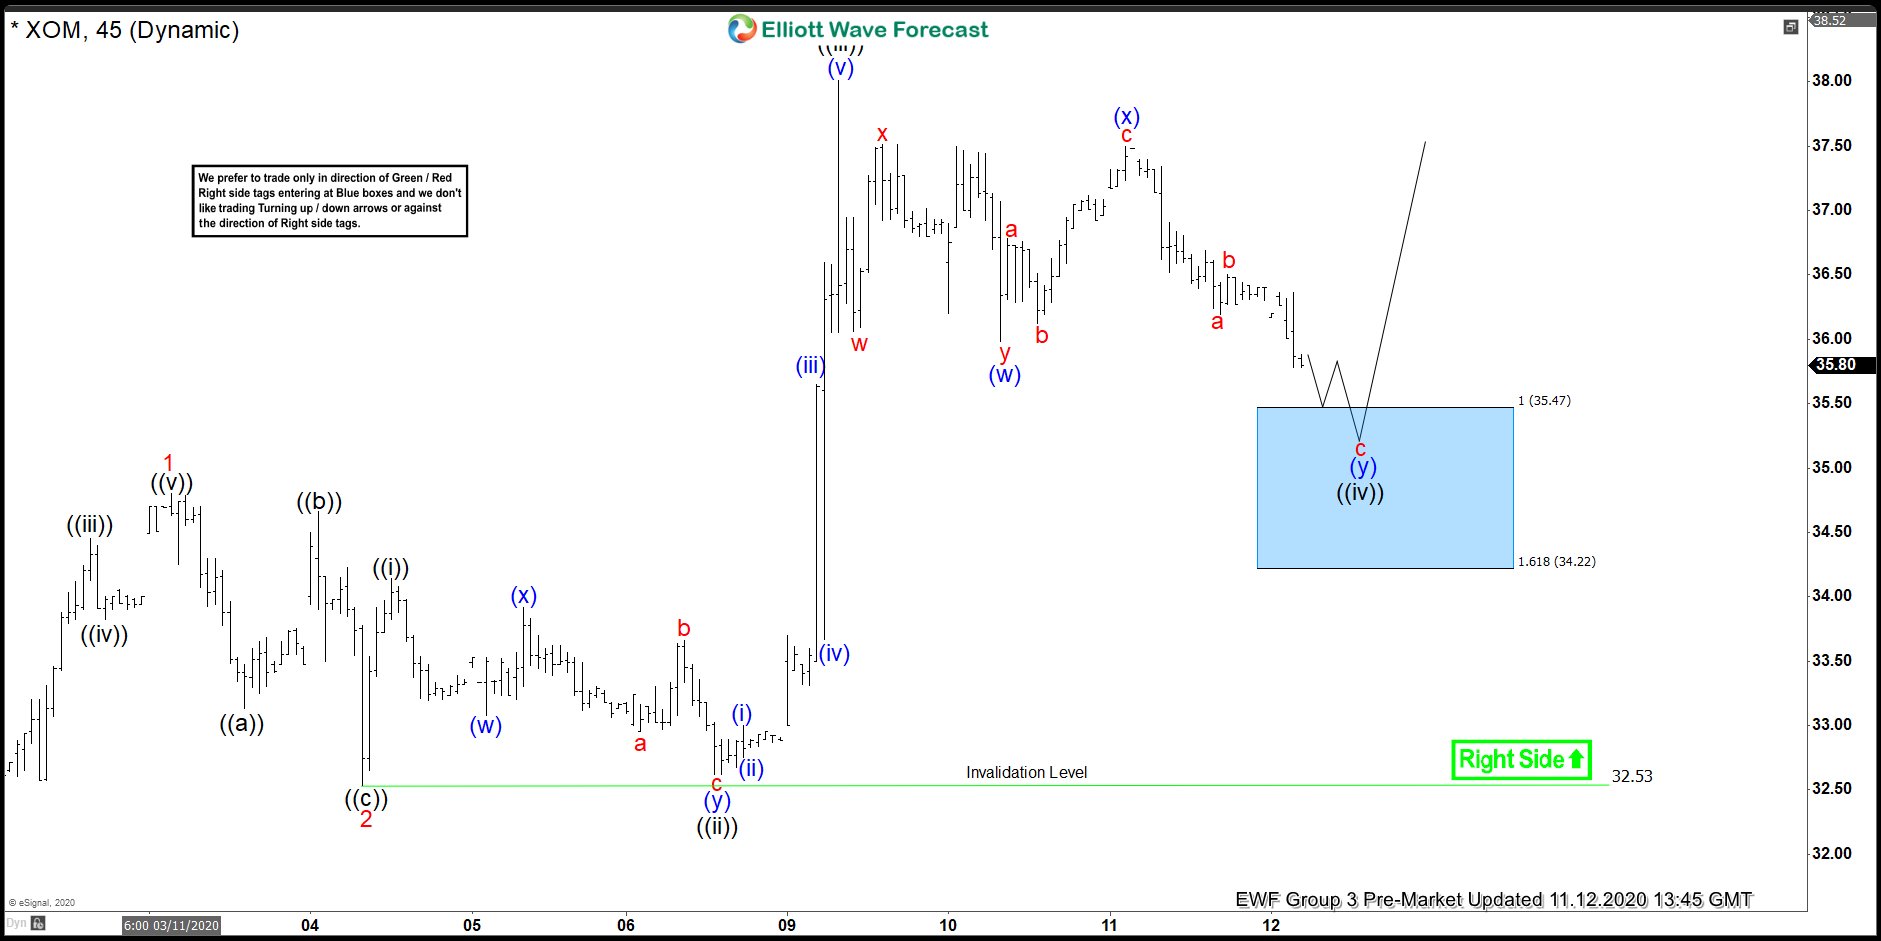
XOM Found Buyers At The Blue Box Equal Legs Area
Read MoreAnother instrument that we have been trading lately is Exxon Mobil Corporation ( $XOM ) from Group 3. In this technical blog we’re going to take a quick look at the Elliott Wave charts of $XOM, published in members area of the website. As our members know, XOM has been showing incomplete impulsive sequences from […]
-
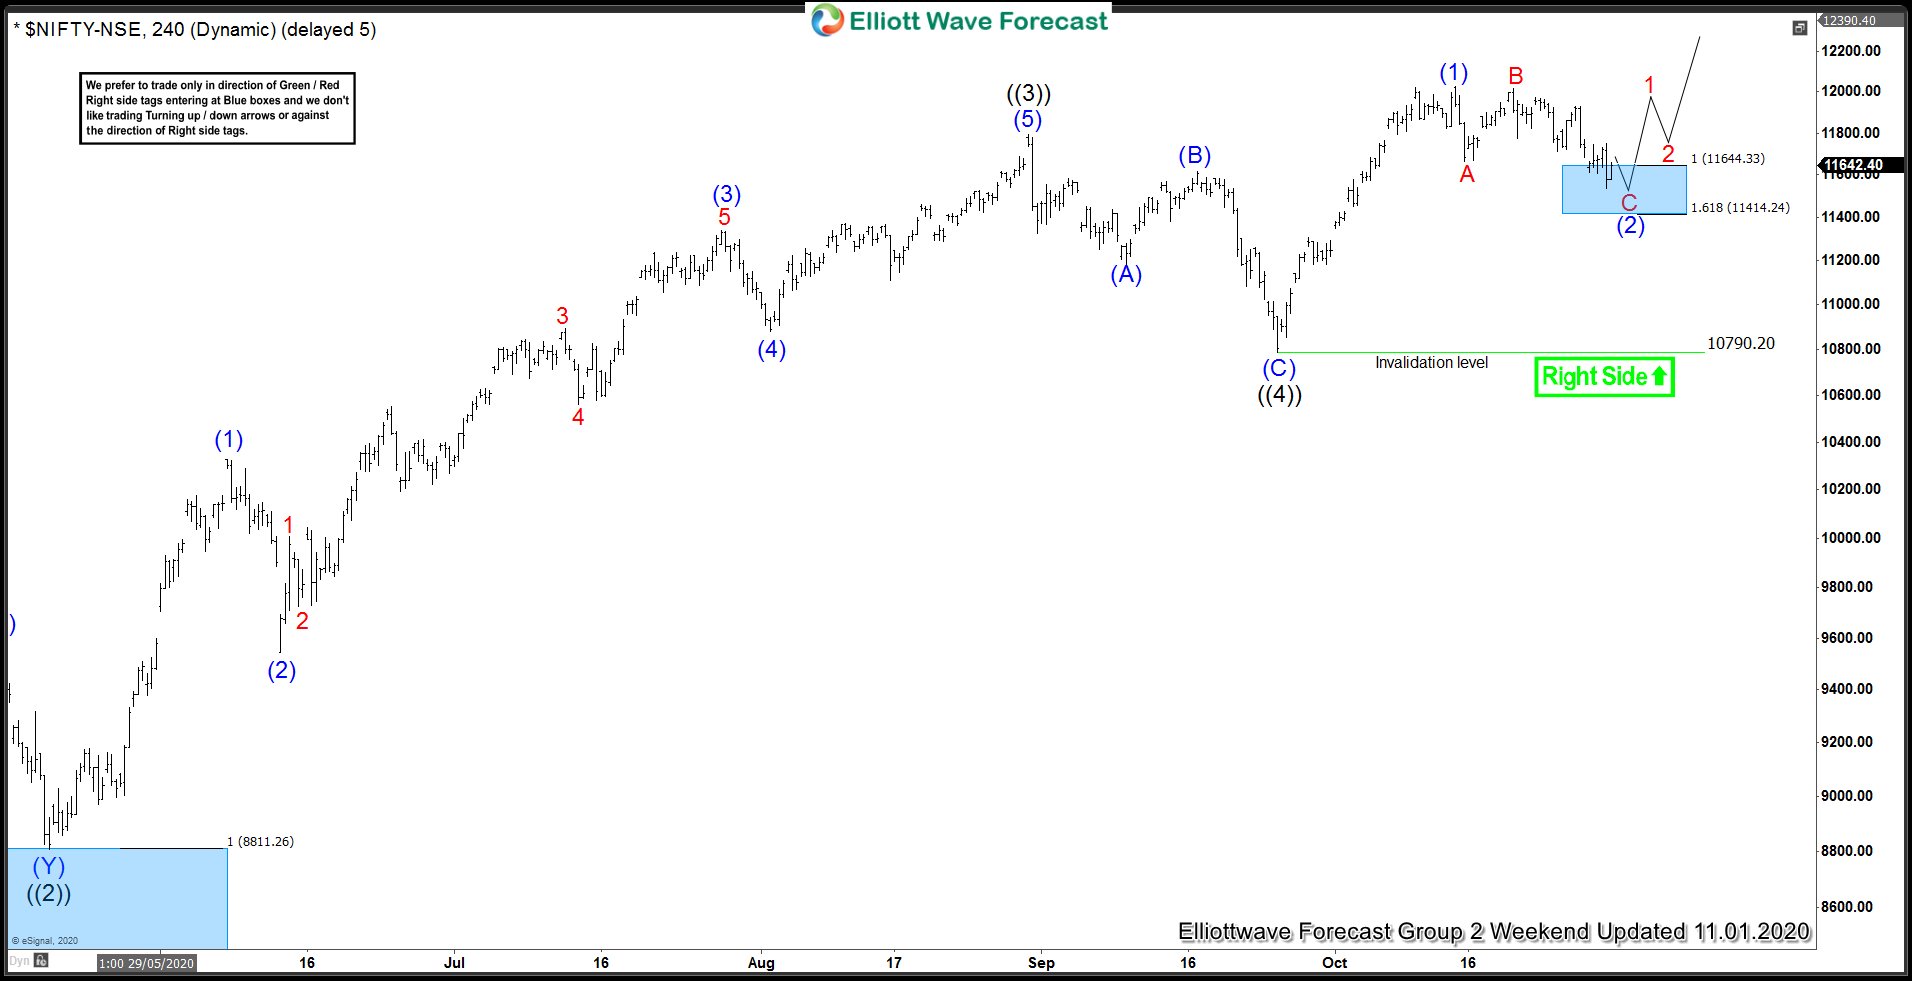
Nifty Buyers Entered At Blue Box: Perfect Entry Again
Read MoreNifty ended an impulse advance from September 24 low to October 15 high and started pulling back. The pull back was corrective so we expected it to end the correction and resume the rally for a new high in wave ((5)) extension or produce a bounce in 3 waves at least. Let’s look at the […]
-
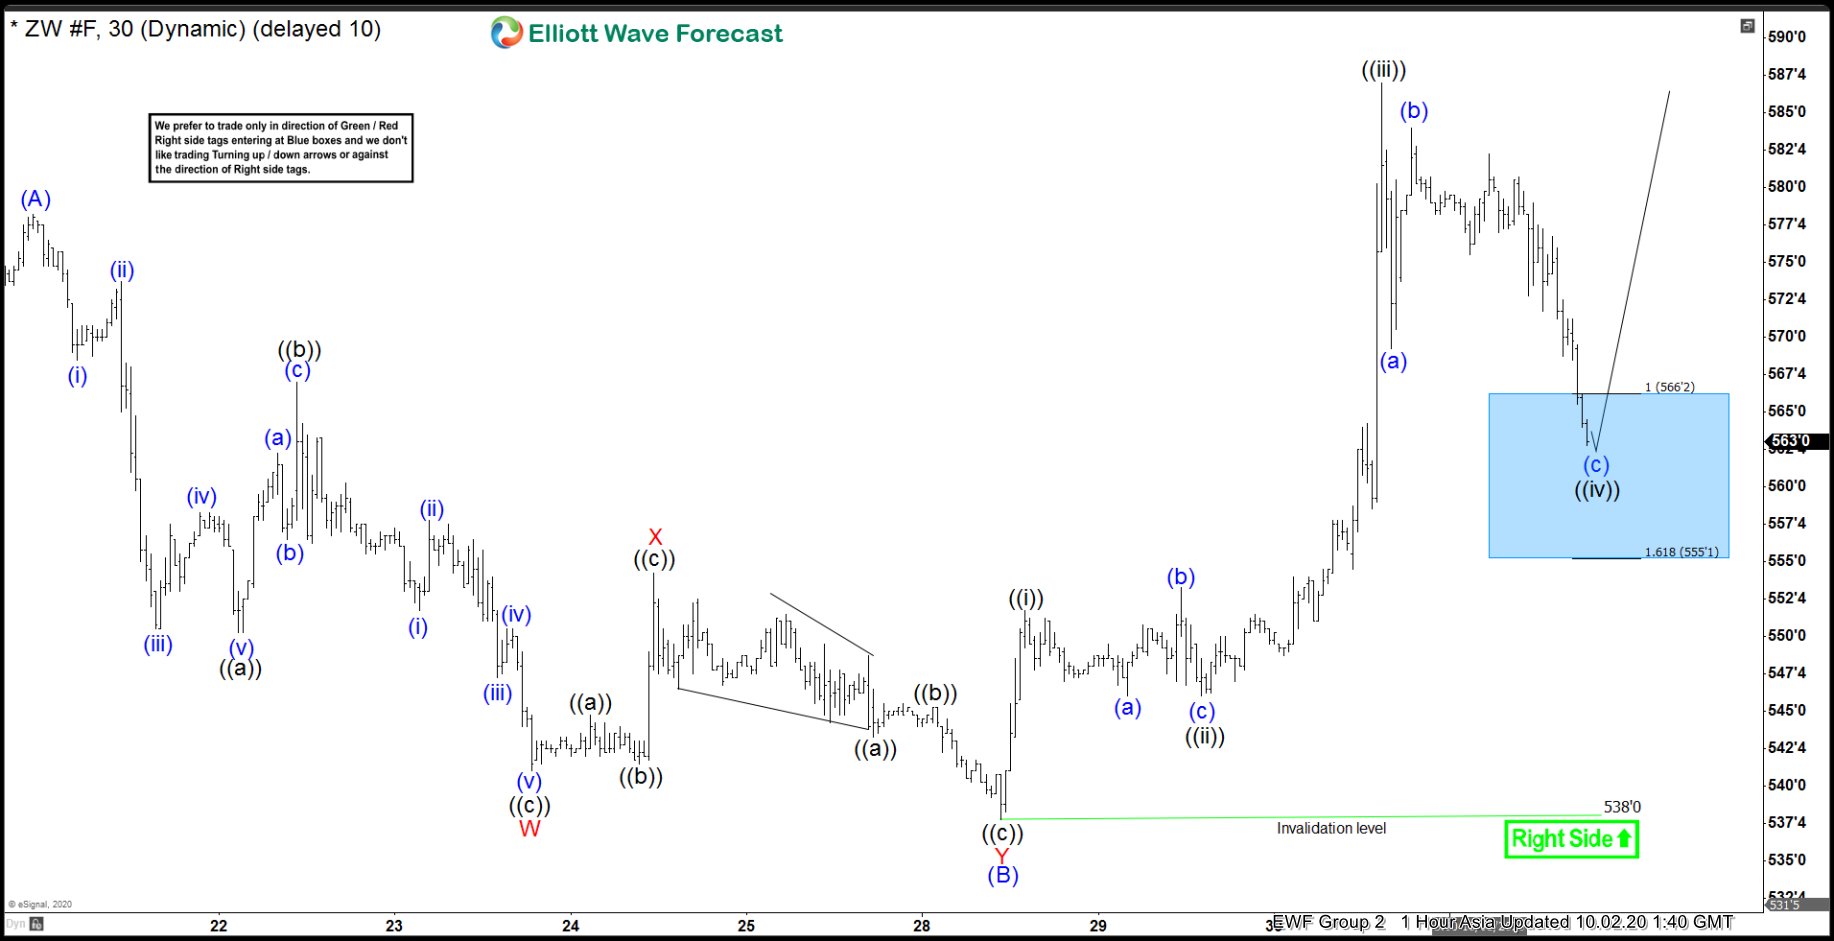
Wheat ZW_F Buying The Dips At The Blue Box Area
Read MoreHello fellow traders. In this technical blog we’re going to take a quick look at the Elliott Wave charts of Wheat Future ZW_F , published in members area of the website. As our members know, ZW_F is another instrument that we have been trading lately. Future is showing higher high sequences in the cycle from […]
-
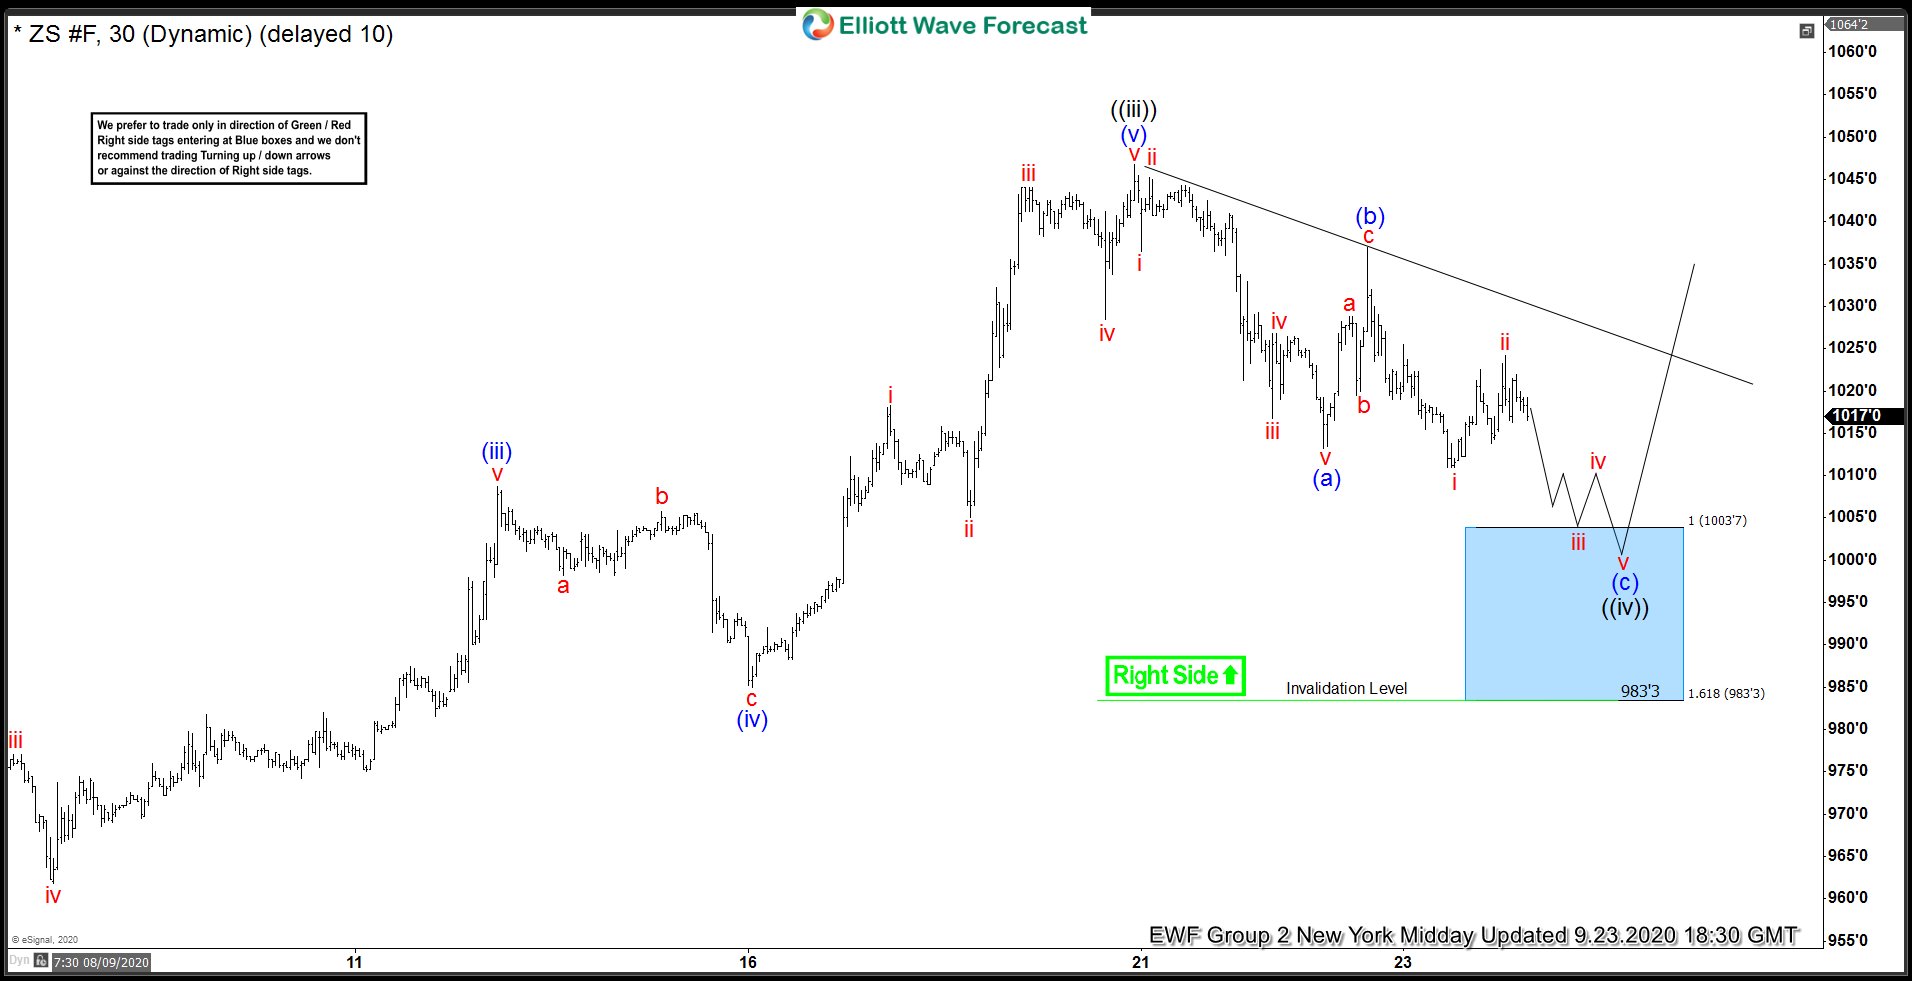
Soybeans ZS_F Buying The Dips After Elliott Wave Zig Zag Pattern
Read MoreHello fellow traders. In this technical blog we’re going to take a quick look at the Elliott Wave charts of Soybeans ZS_F , published in members area of the website. As our members know, ZS_F is showing impulsive sequences in the cycle from the April 808’0 low. Consequently we’ve been calling rally in Soybeans. Recently […]
-
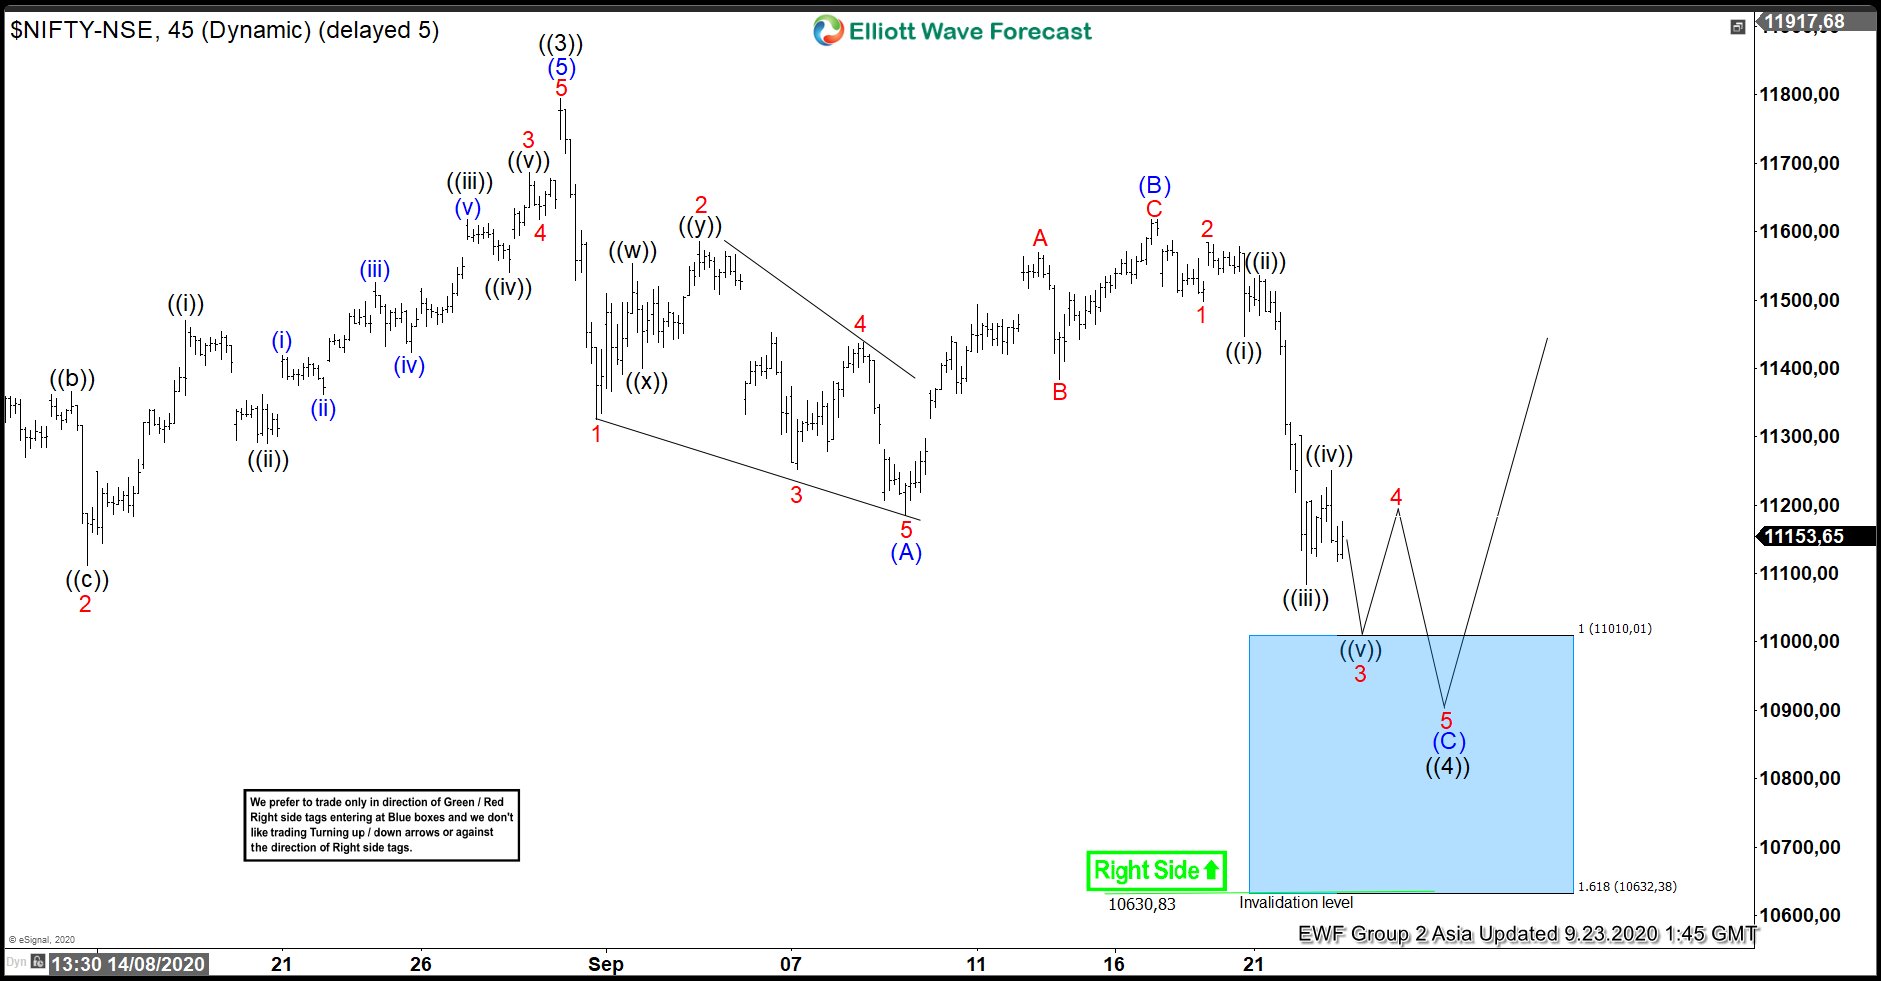
Nifty – Forecasting The Rally From Elliott Wave Blue Box
Read MoreNifty saw a high of 11794.25 at the end of August and then turned lower, we told members the decline should be corrective and present another opportunity for the buyers to enter the market. In this article, we will look at how the decline unfolded and also view the blue box area that we highlighted […]