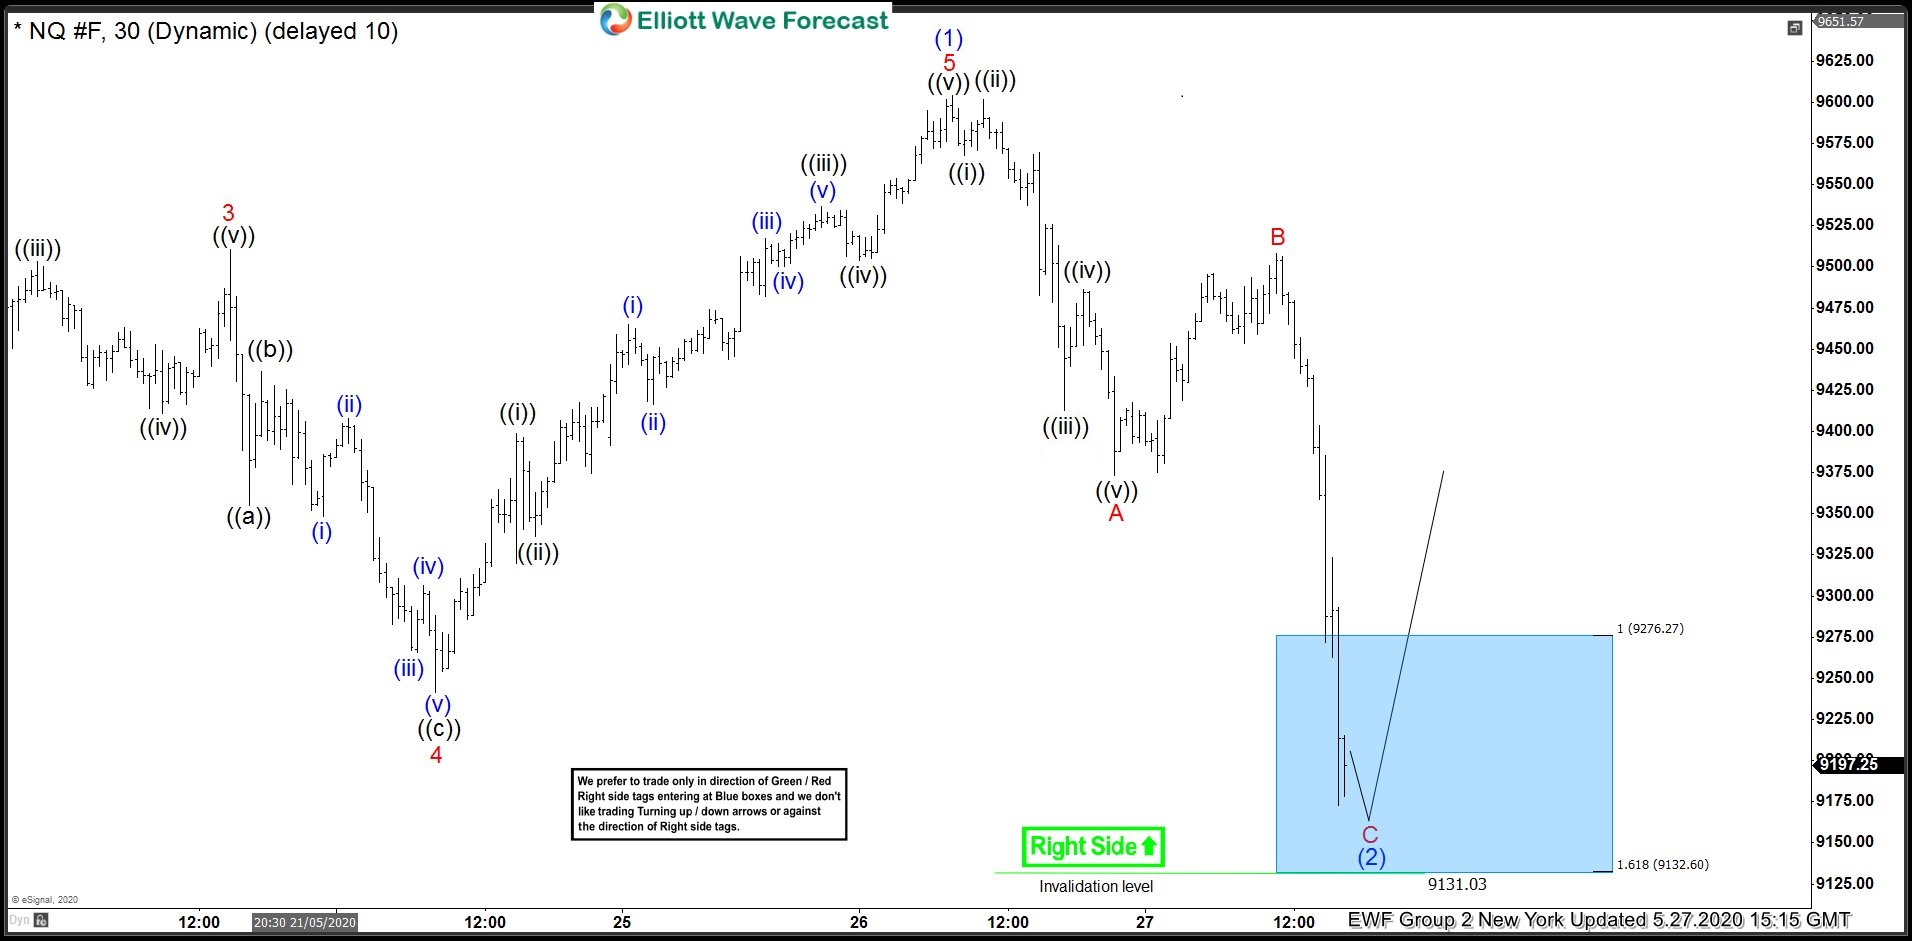
Nasdaq Futures made a sharp decline yesterday before reacting higher strongly into the closing for the day. In this article, we would take a look at the charts we presented to clients yesterday and the blue box area we highlighted for 3 waves decline to end and buyers to appear for the rally to resume or a 3 waves bounce at least to take place. Blue Boxes are High-Frequency areas which are based in a relationship of sequences, cycles and calculated using extensions. We also call these areas no-enemy areas because majority of the times, both buyers and sellers agree in these blue box areas in direction of the next move for 3 swings at least. Let’s start by taking a look at New York chart update from yesterday.
Nasdaq Futures 27 May 1 Hour New York Elliott Wave Update
Chart below shows wave (1) ended at 9604. As per Elliott Wave Theory, after a 5 wave move ends, there should be a pull back to correct the 5 waves rally and this pull back could take different forms like a Zigzag, FLAT, Double Three Elliott wave structure etc. Drop to 9373 completed wave A and this was followed by a bounce to 9508 which completed wave B and wave C of (2) was expected to complete in the blue box area shown on the chart and hold above 9131 level for a turn higher in wave (3).
Nasdaq Futures 27 May 1 Hour Midday New York Elliott Wave Update
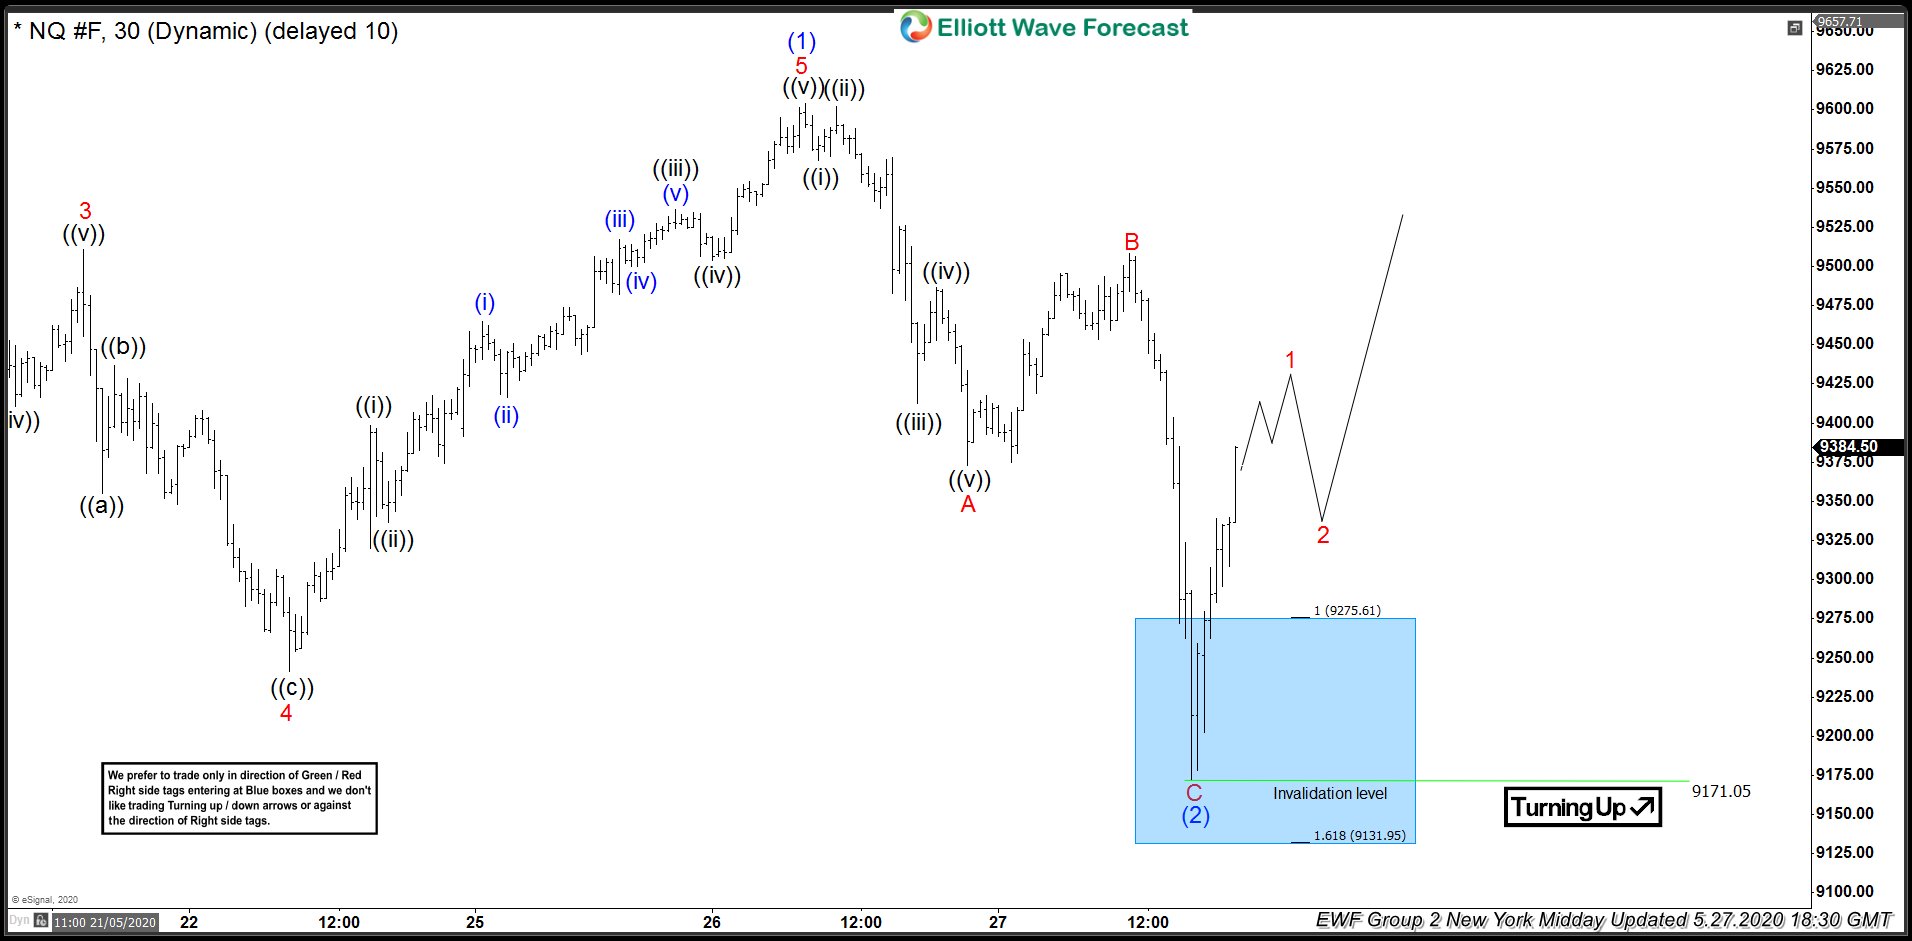
Chart below shows wave C of (2) completed at 9171 and Nasdaq Futures saw a sharp reaction higher after buyers entered in the blue box as expected. At the time of printing the chart, price had already reached 50% retracement of the decline from B wave high allowing any buyers which entered in blue box to eliminate risk. We expected some more upside to complete red wave 1 before a pull back in wave 2 to correct the rally from 9171 low and higher again.
Nasdaq Futures 28 May 1 Hour London Elliott Wave Update
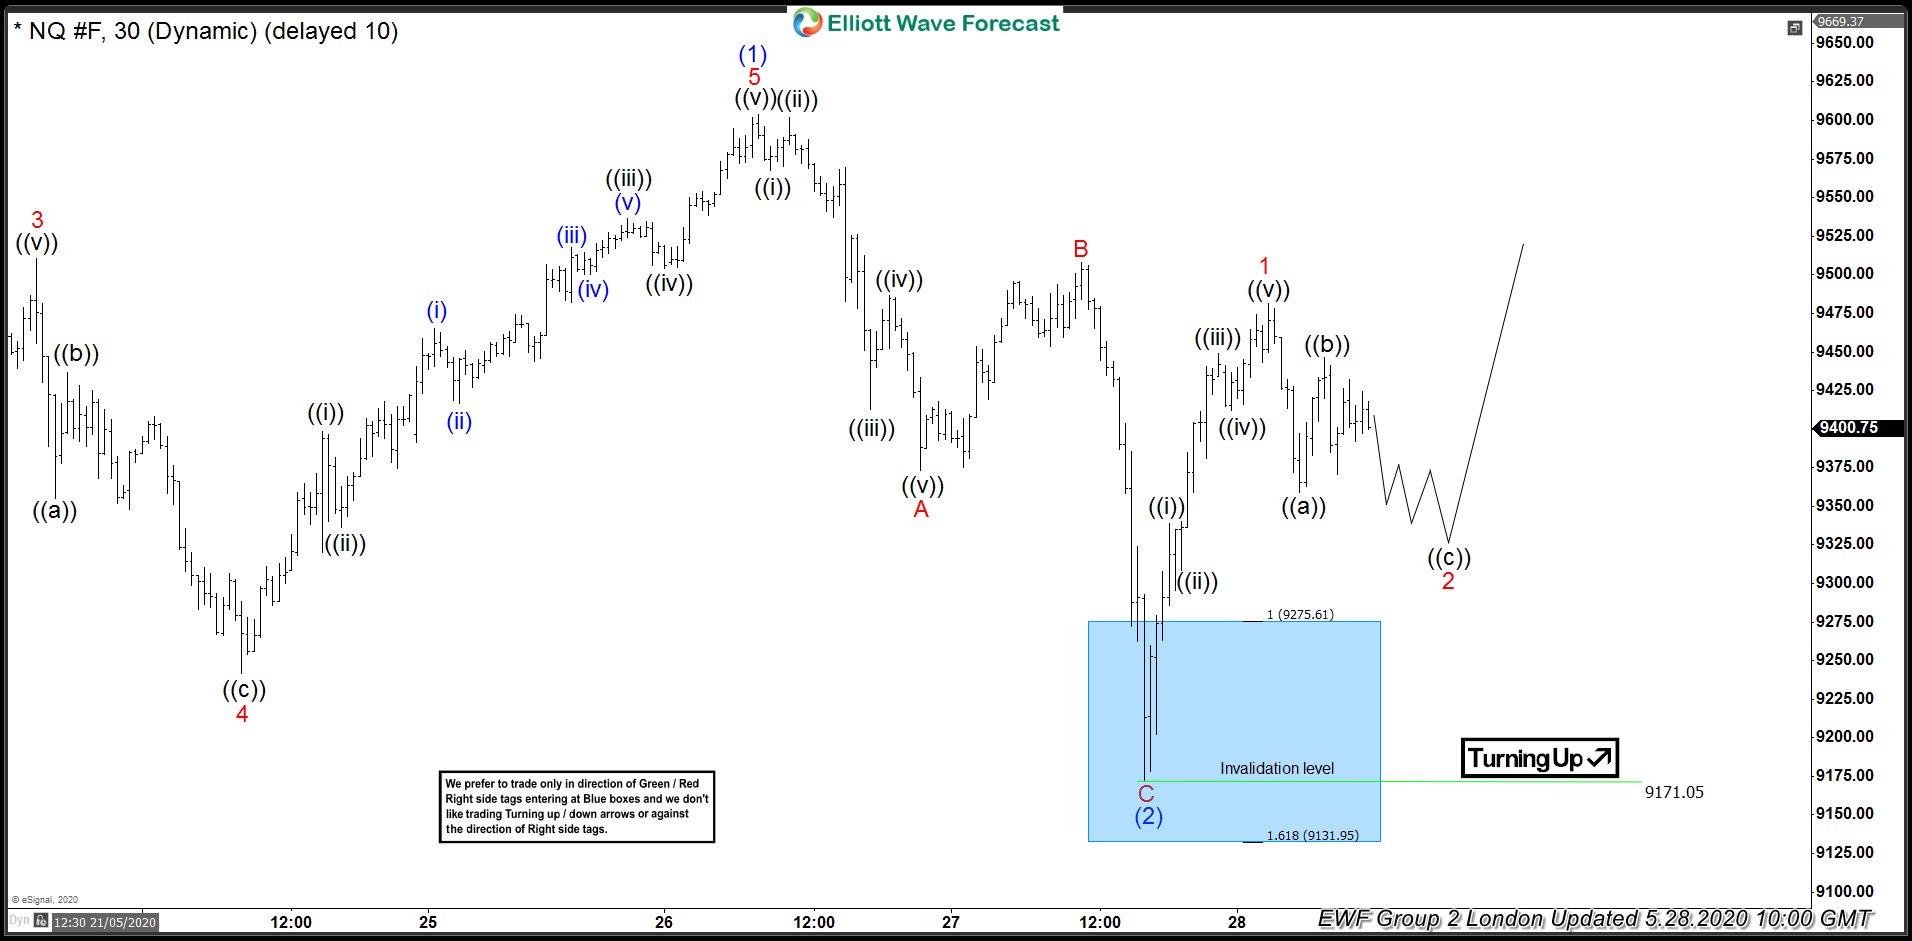
We complete 5 waves rally from yesterday’s low in wave 1 and now expected a pull back in wave 2 in 3 waves before the rally resumes. Price should stay above 9171 low for this idea to remain valid.
Nasdaq Futures 28 May 1 Hour New York Elliott Wave Update
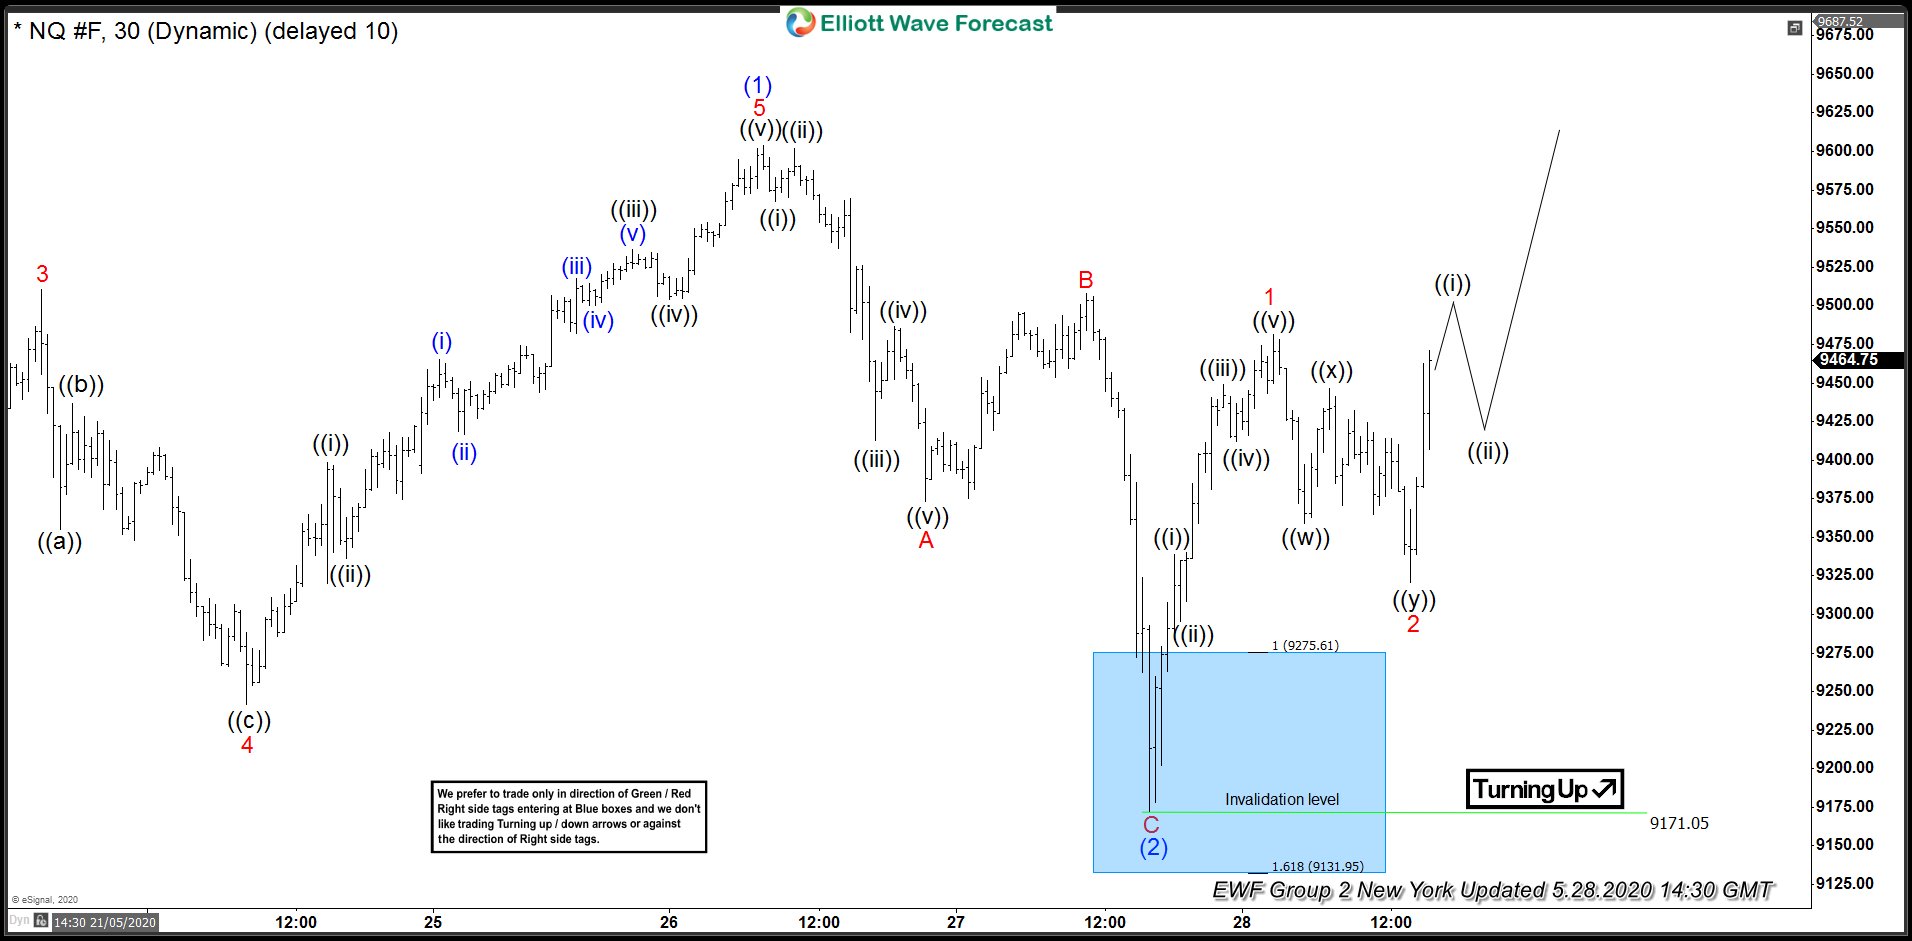
Chart below shows Nasdaq futures completed wave 2 pull back and are about to break above red 1 peak. A break above red 1 peak would suggest dips should hold above today’s low for extension higher toward 9631 – 9824 area within proposed red wave 3.
Back


