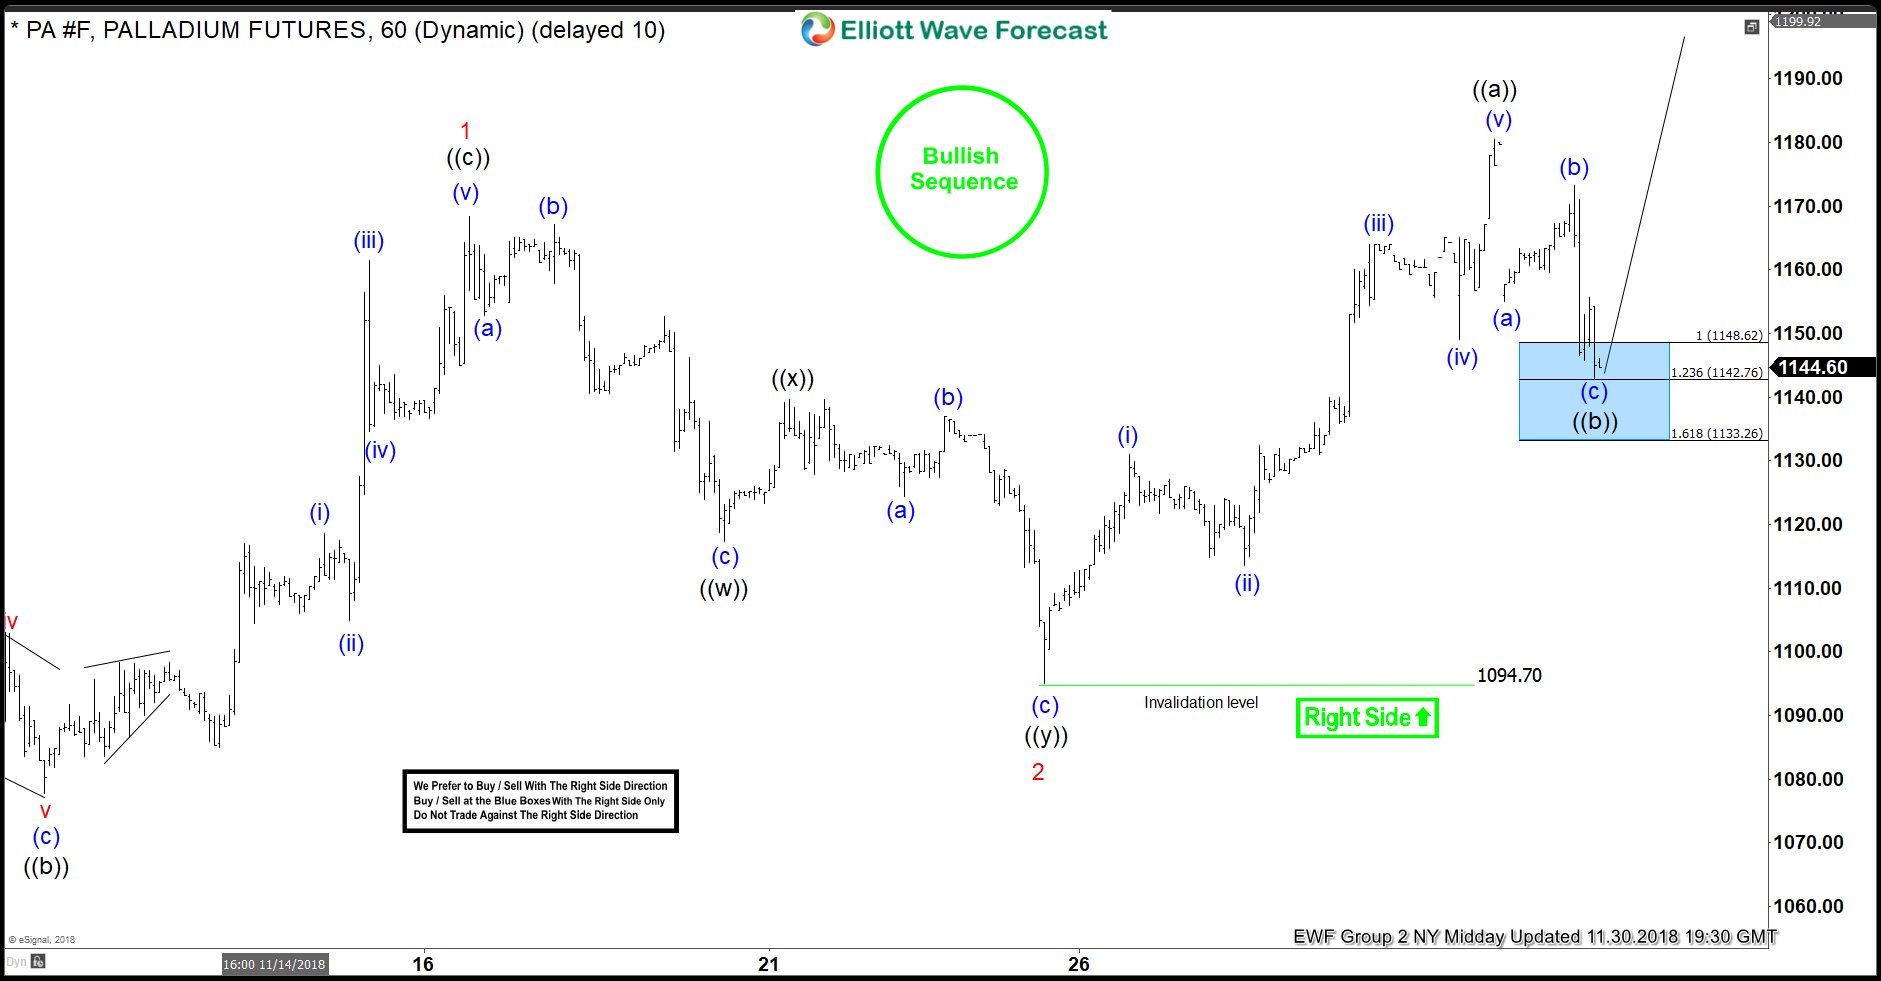
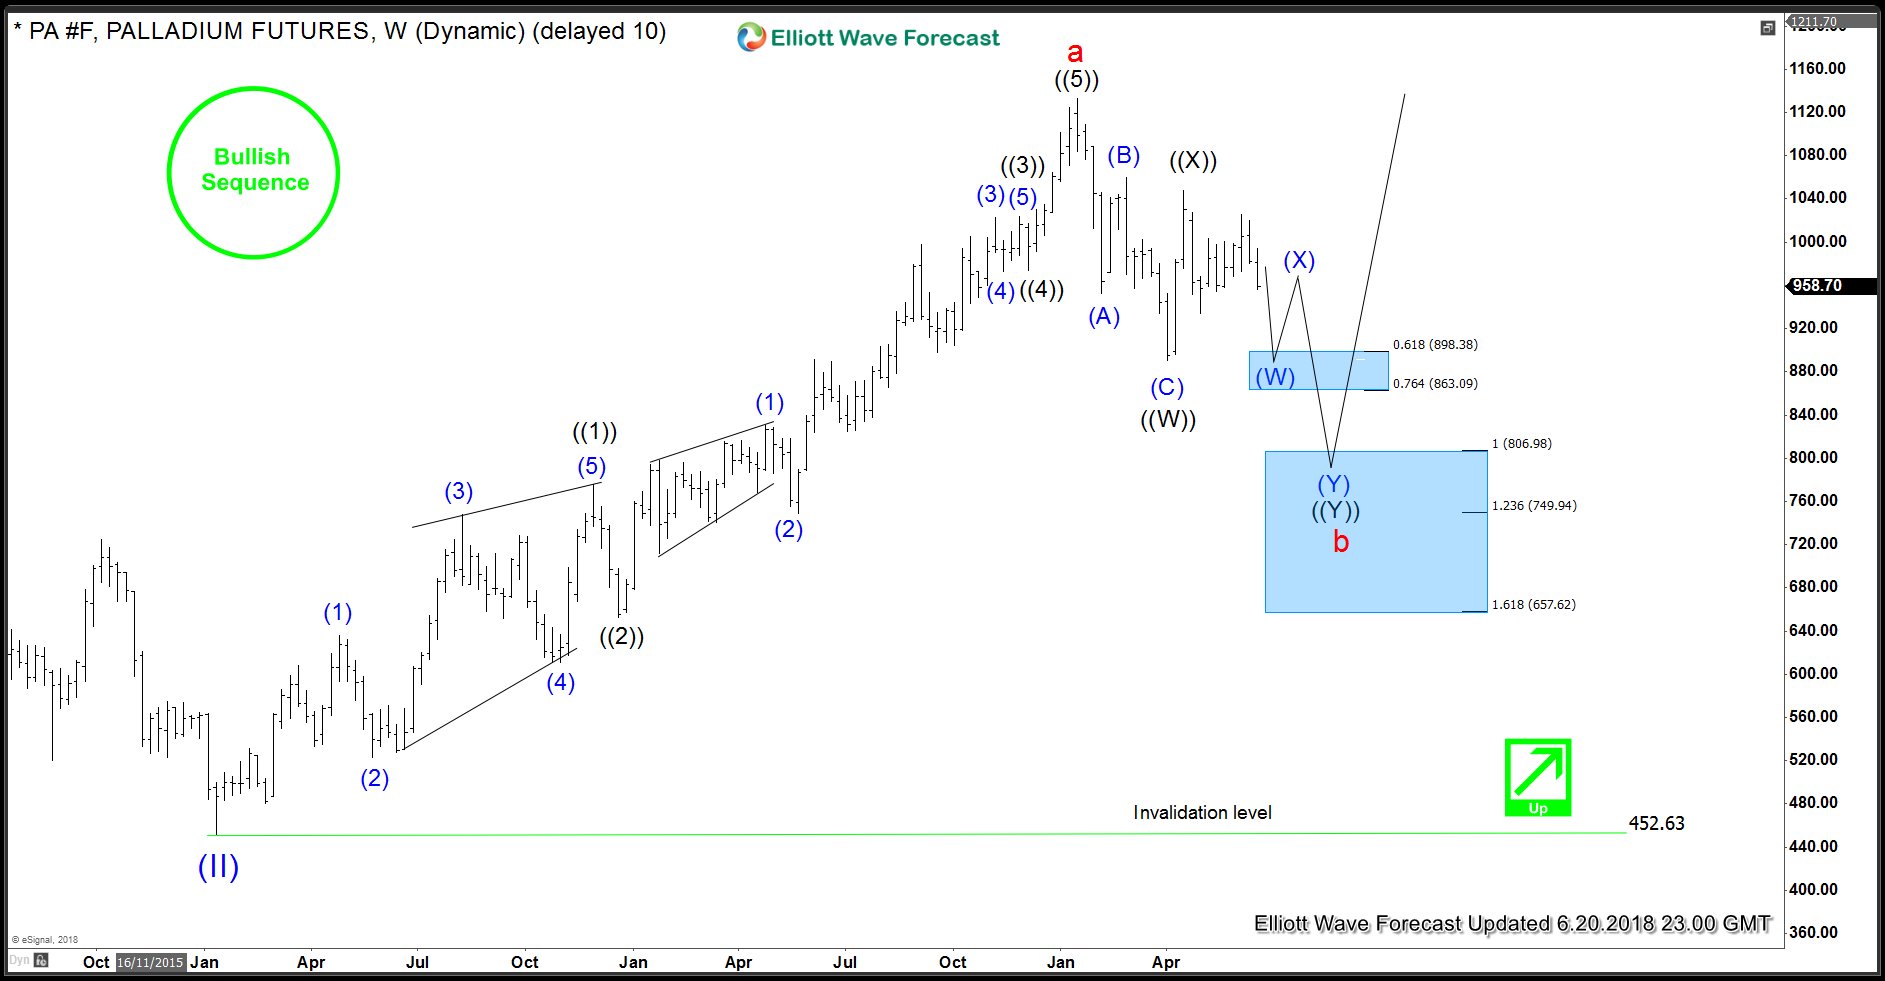
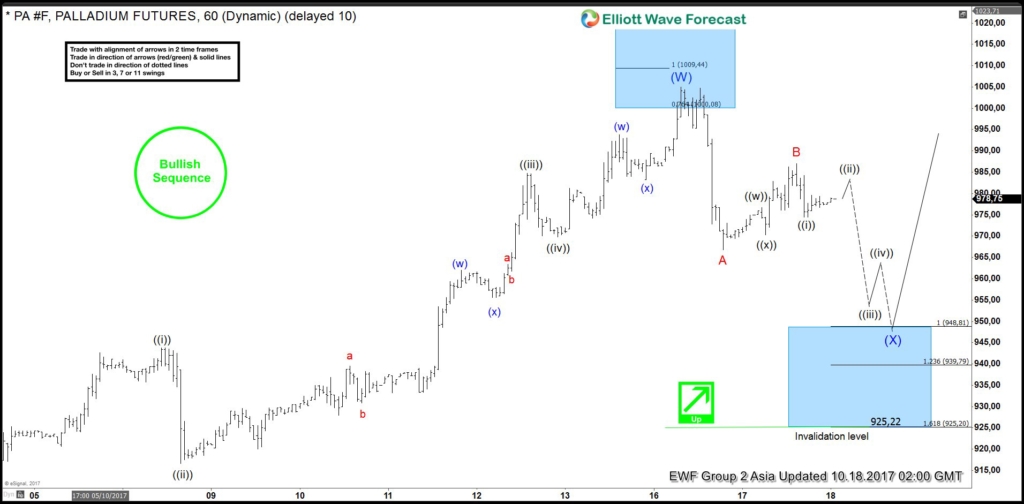
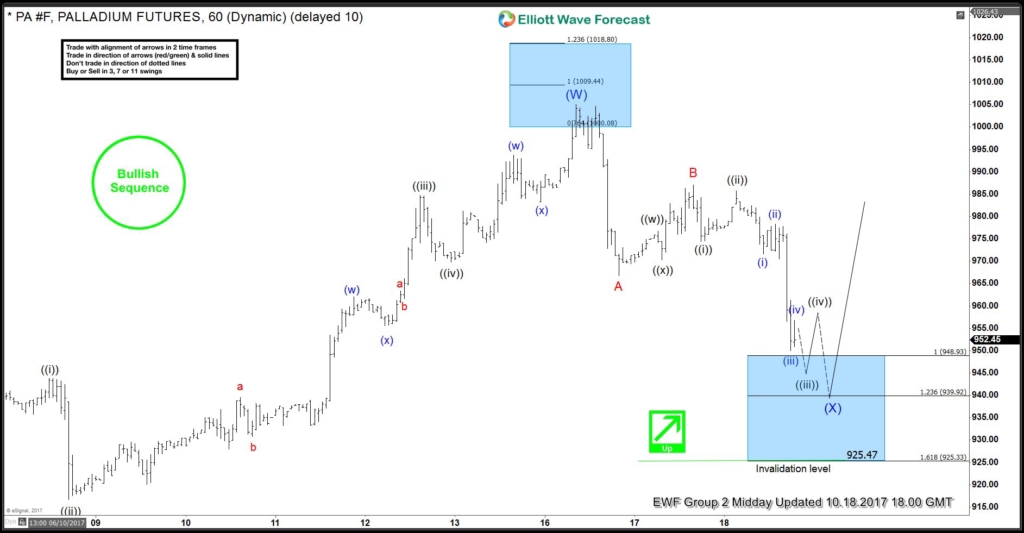
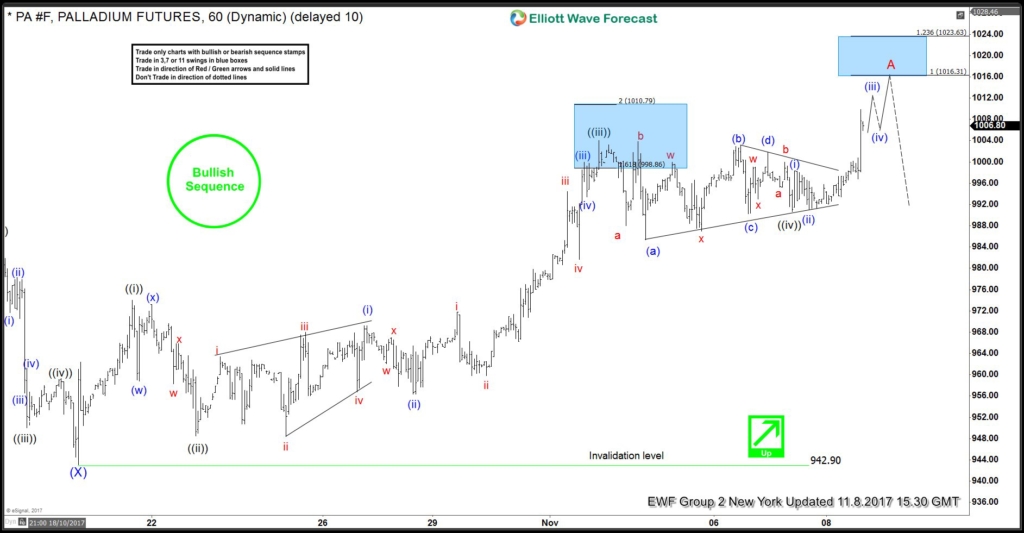
In this blog, I want to share some short-term Elliott Wave charts of Palladium which we presented to our members in the past. Below, you see the 1-hour updated chart presented to our clients on the 11/30/18 indicating that Amazon ended the cycle from 11/23 low (1094.70) in black wave ((a)) at 11/30 peak (1198.1).
As Palladium ended the cycle from 11/23 low in black wave ((a)). It started a pullback lower in black wave ((b)). The pullback proposed to unfolded as an Elliott Wave Zig Zag correction. Due to the right side bullish stamp, which you can see in the chart below. We advised members that we like buying Palladium at the equal legs from 11/30 peak. Therefore, we expected buyers to appear in the dips in the sequences of 3, 7 or 11 swings. At the 100 – 1.236 Fibonacci extension of blue (a)-(b). Which came at around 1148.62-1142.76 area. The commodity reached that blue box in the chart below and we opened a long position in that area. As that was the first area for buyers to appear to take prices to new highs above wave 1 peak or a larger 3 waves bounce at least.
Palladium 11.30.2018 1 Hour Chart Elliott Wave Analysis
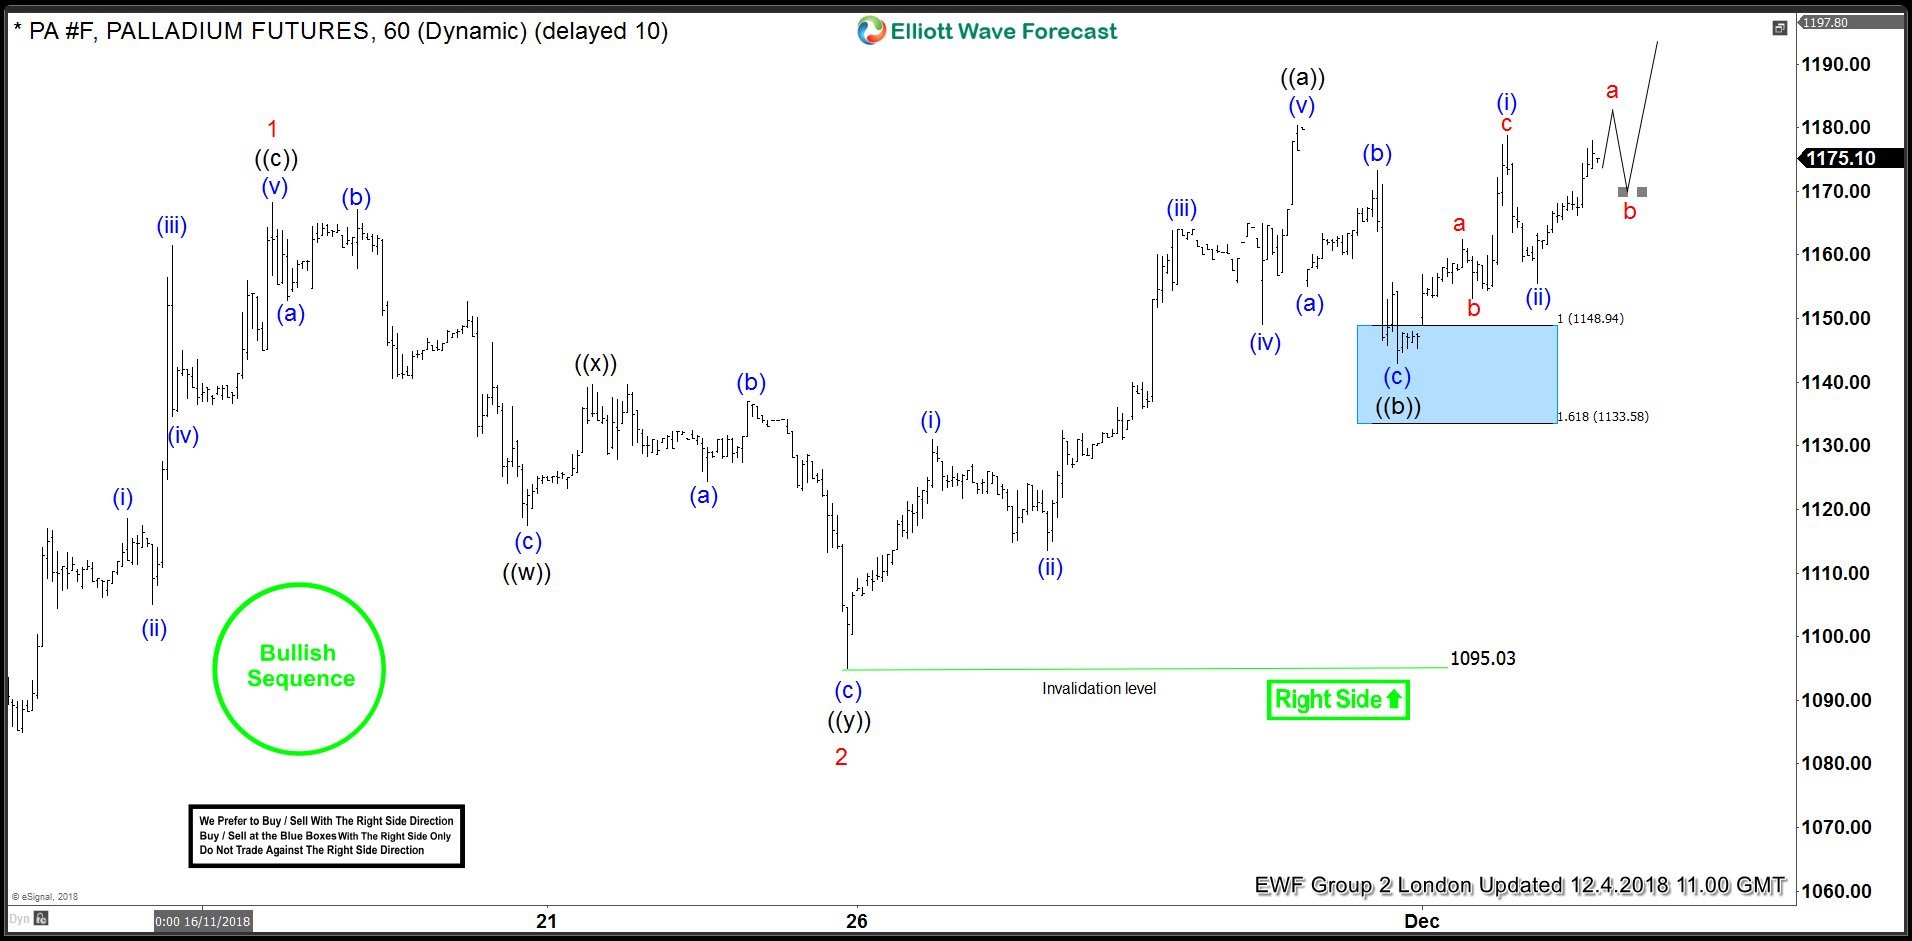
In the last Elliott Wave chart, you can see that Palladium bounced nicely higher from the equal legs area (blue box). Our members bought the equal legs from 1148.6+ areas and any trade from that area are risk-free which means the stop should be at breakeven, targeting higher levels. Do please keep in mind that the 1-hour chart which I presented may have already changed. If you want updates every day. I can recommend you to take our December special below.
Palladium 12.04.2018 1 Hour Chart Elliott Wave Analysis
I hope you liked this blog and I wish you all good trades and if you are interested in learning more about our unique blue box areas and also want to trade profitably then sign up for our December Promotion and get 30% Discount on Gold and Platinum plans!!
We believe in cycles, distribution, and many other tools in addition to the classic or new Elliott Wave Principle. To get a regular update on the market and Elliott wave charts in 4-time frames.
Join us today and get 30% off on all monthly plans and see our latest trading setups and charts.
