Ten Year Notes ($ZN_F) low 10.08.2018 will decide the Extension in $SPY
Many Traders use to trade only one instrument and fall into the trap of isolation resulting in seeing only just a little piece of the whole Market. We at elliottwave-forecast.com pay attention to the entire Market because we believe each instrument plays a part in the whole market. Sometimes the most insignificant instrument can offer the clue to have the right forecast or profitable trade. There is no secret that the Elliott wave Theory can offer more than one path, and there is always an alternate view or path. We do not feel comfortable providing alternative views, because we have developed a system to locate the right side, and only present the scenario with a higher probability.
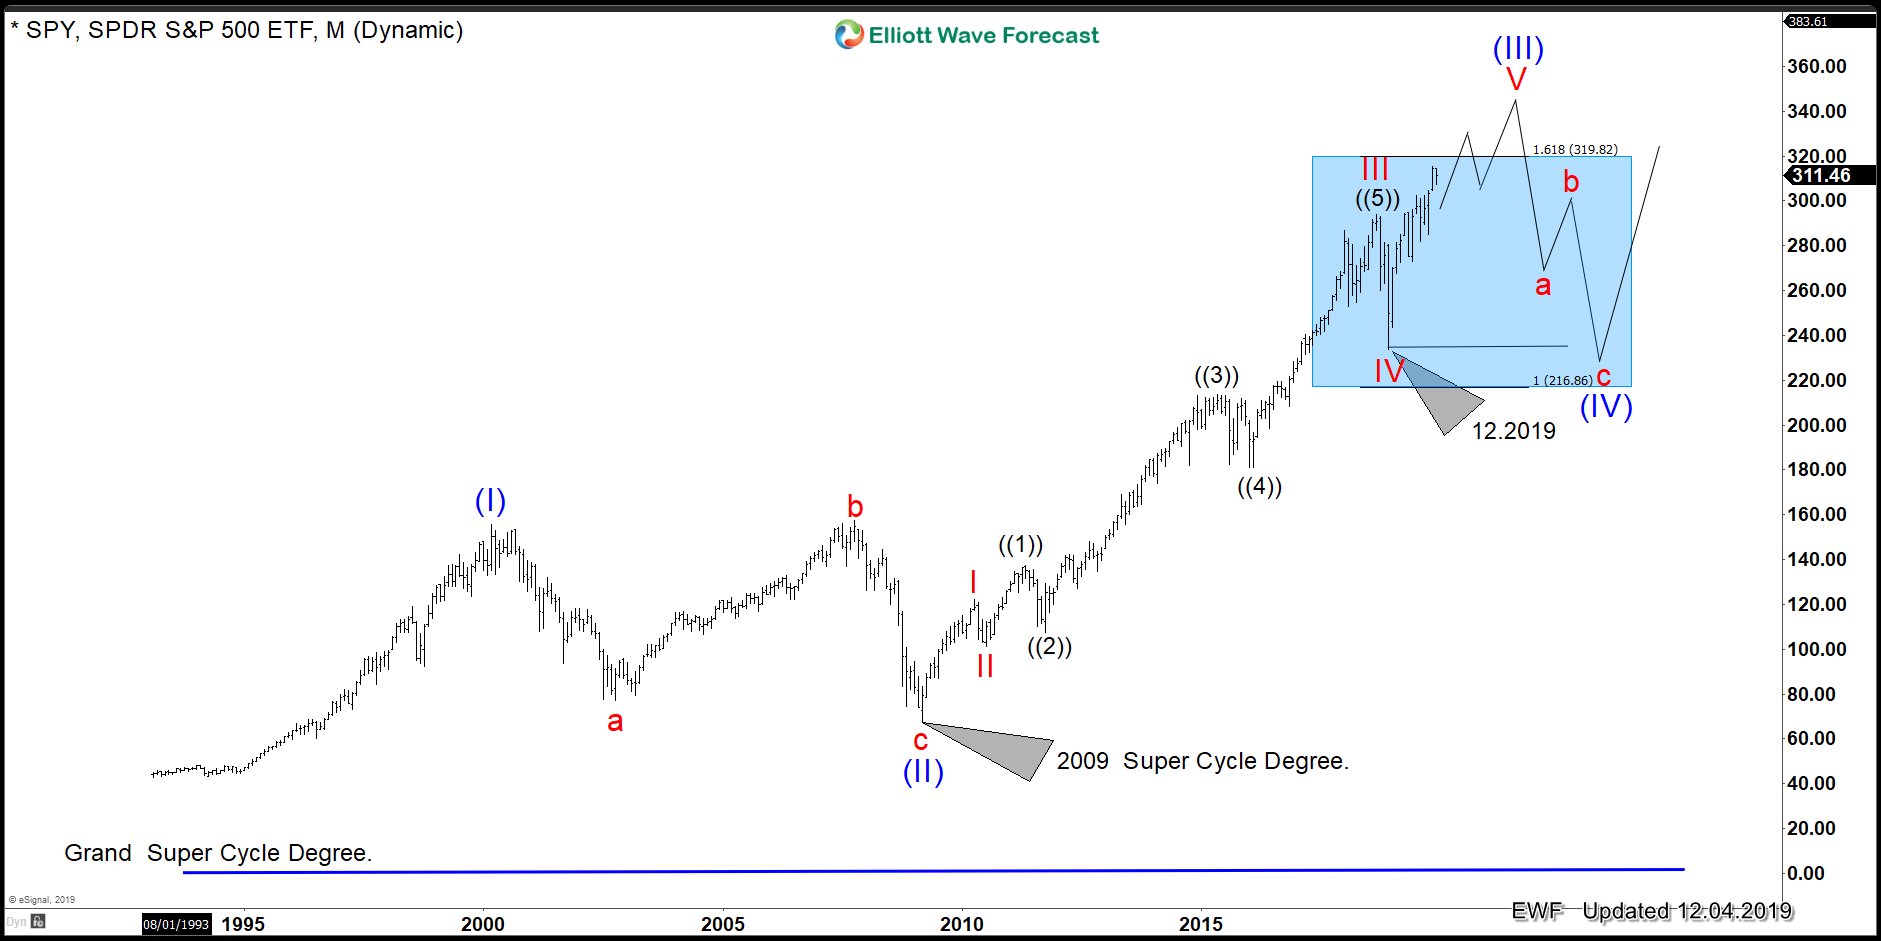
In this article, we will show how to forecast the most probable path for $SPY by looking at other instrument. On the chart below, $SPY shows five waves from 2009 low within the Super Cycle degree:
$SPY Elliott Wave Monthly Chart

Many Elliott wavers will start selling and picking a top and we never recommend that to our members. There is always a risk because an impulse can extend all it wants, and the picker will end up losing. As we have mentioned before, we analyze every instrument to gather the most probable path. Back in the summer, when the Index makes new all-time highs and shows the five waves from 2009, sellers tried to pick the top. We, at that time, knew there was no chance of a top in place because of a simple instrument $SEKJPY.
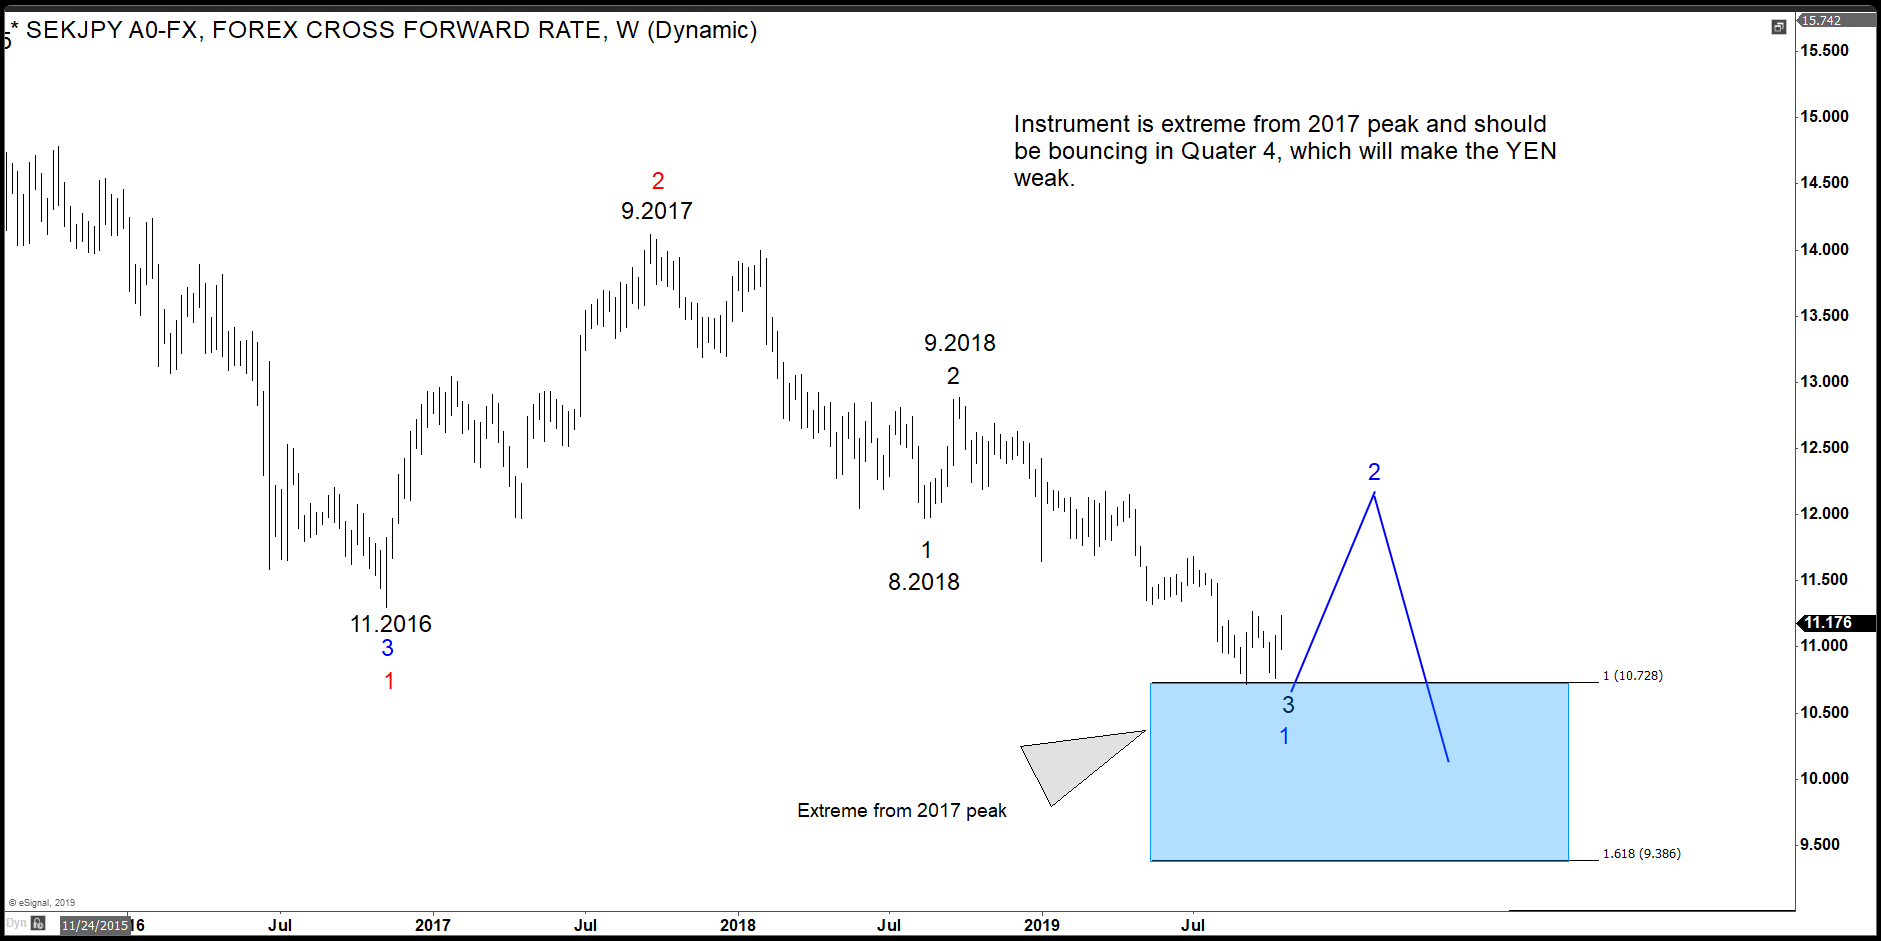
Looking at the $SEKJPY sequence below, we identified a cycle from September 2017 high was ending. Consequently, a three waves rally was about to happen, making the YEN weak and indices higher. Here is the chart of the $SEKJPY showing the sequences, Blue Box and bounce to happen:
SEKJPY Elliott Wave Weekly Chart

From the chart above, we can see the bounce has not ended, and consequently, more YEN weakness should occur, making $SPY extend into the 340-370 area. When $SPY reaches this area, another instrument will provide the clue whether the low at 12.2018 will be a wave ((1)) within wave V or the whole wave V in red.
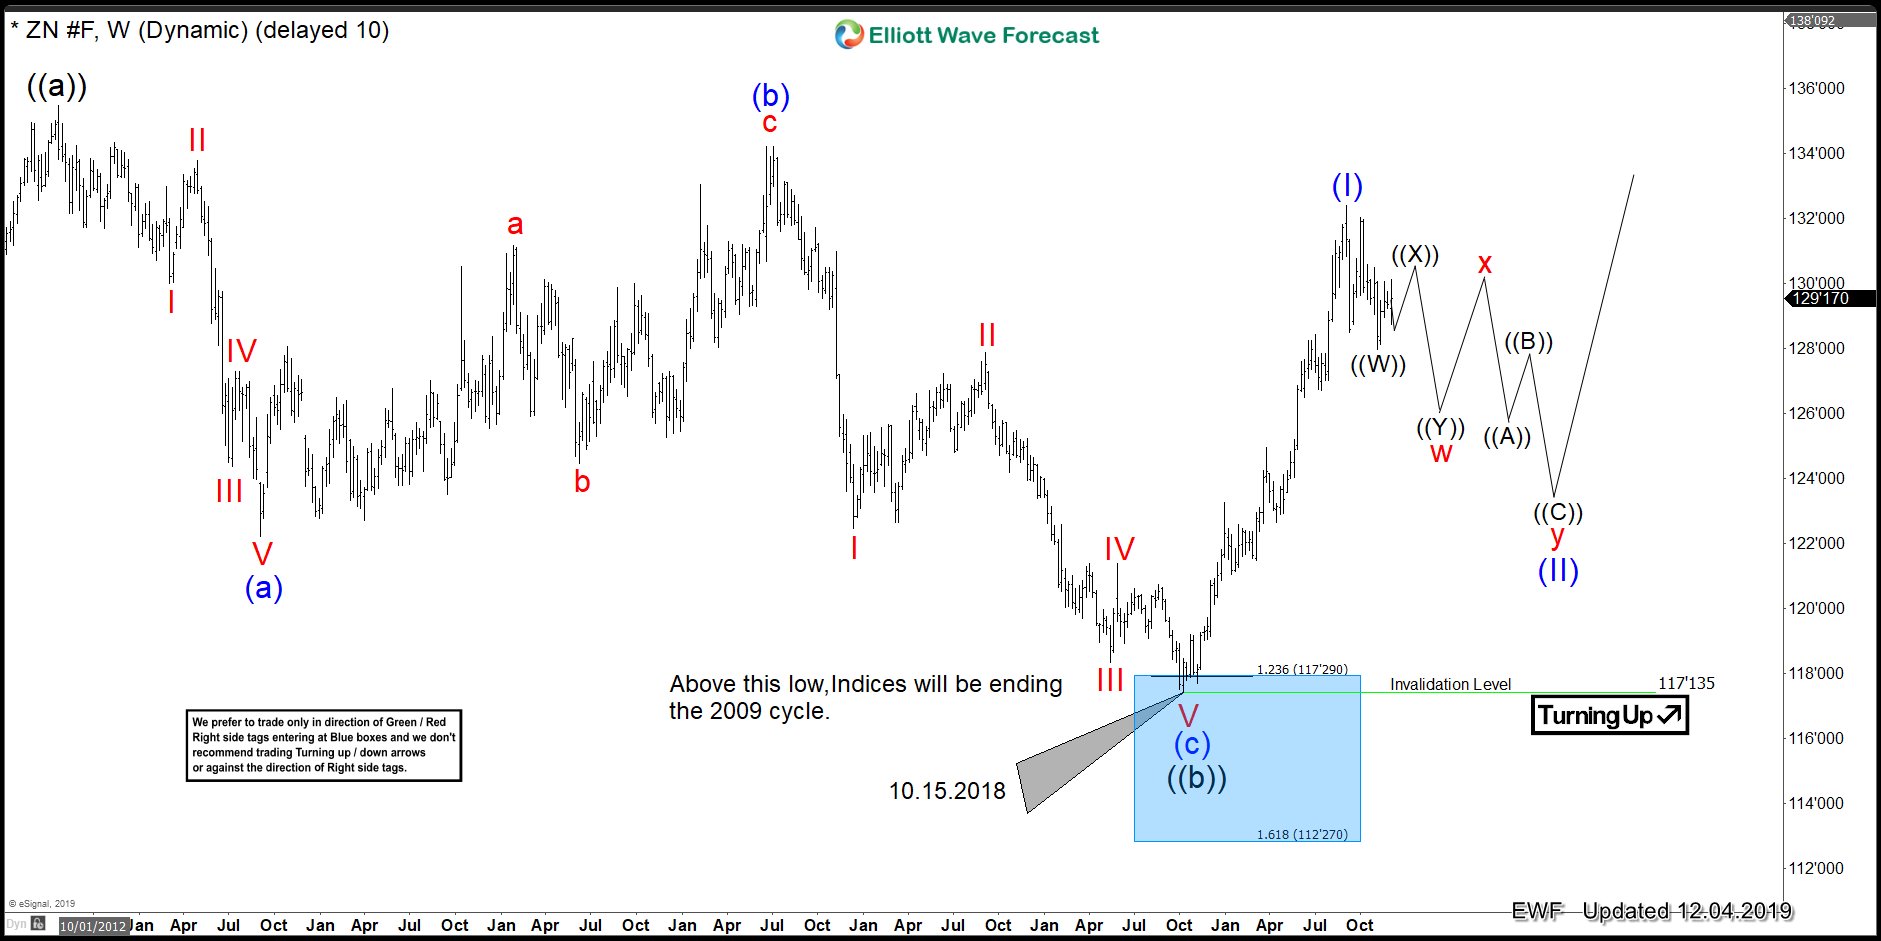
We identify another instrument $ZN_F (10 Year Notes) is critical to understand $SPY. The Notes has reached the Blue Box from the peak at 7.23.2012 and bounced strongly in an impulse, as the following chart shows:
$ZN Elliott Wave Weekly Chart

Our way to relate the Market is telling us that, as far as the low from 10.15.2018 in $ZN remains in place, $SPY should be ending the cycle from 2009 and soon will pullback in a big wave (IV). If the low at 10.15.2018 in $ZN_F gives up, it will create a five swing decline from 7.23.2012 high. This should generate an extension within the cycle since 2009 low in $SPY which can take the Index above 400 and close to 500. The point is that trader needs to understand that the right side is critical and reading the whole Market is vital.
Back
