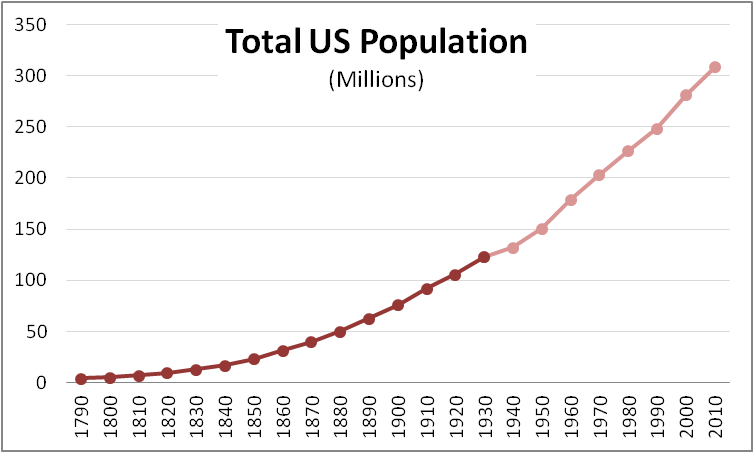
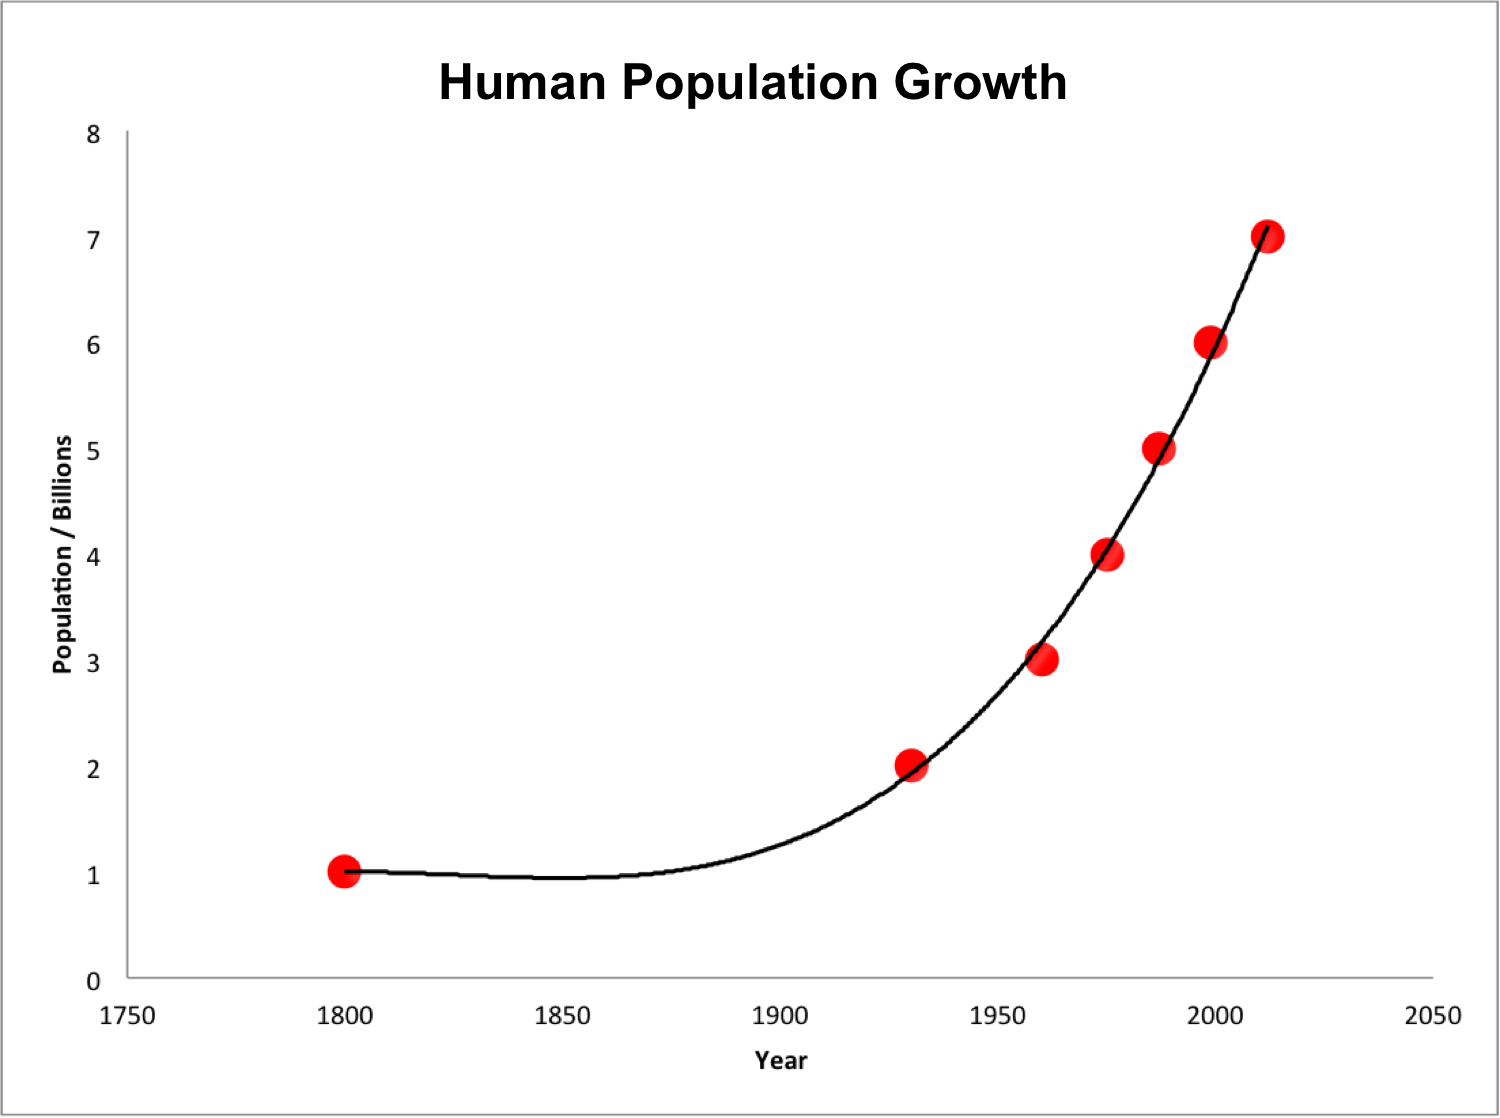
Many Traders after the 2008 decline around the World Indexes have developed this idea that Indexes need to crash and see a decline bigger than the one seen in 2008. We at Elliottwave Forecast, have never agreed with the Idea and have always been bullish the Indexes, not only due to the Technicals but also due to the logic. This is not a secret the Market feeds off several traders, opinions and ideas. Human population has been growing for centuries and it keeps growing every year instead of going down. This means that human population is in a firm uptrend and corrections seen are in the form of wars and pandemic diseases and in this article we will try to show how the trend in human population and Indices is directly correlated.
We, as Humans, have been bullish for centuries and we always will be. Why? because we are Human and look into the Future with optimism and not pessimism. We are always looking to improve things, improve living standards, health conditions and trying to improve the overall quality of life through research & development. Over time, we have come from living in caves to living in nice houses, from travelling on Horses to traveling in nice, fast cars and planes. Elliott wave theory is based on repetitive behavior / patterns of the market but it’s not the patterns which repeat themselves, there is a code behind the market movements that we call the swing sequence which runs in either 5-9-13 or 3-7-11 swings. There is no straight line in trading, the market will always make corrections and one day might see a correction that is even bigger than the one seen in year 2008 – 2009.
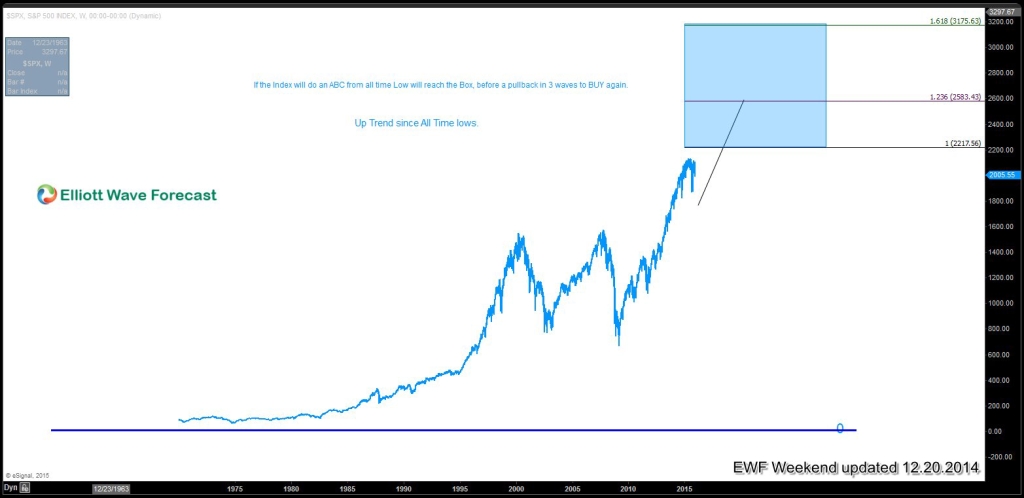
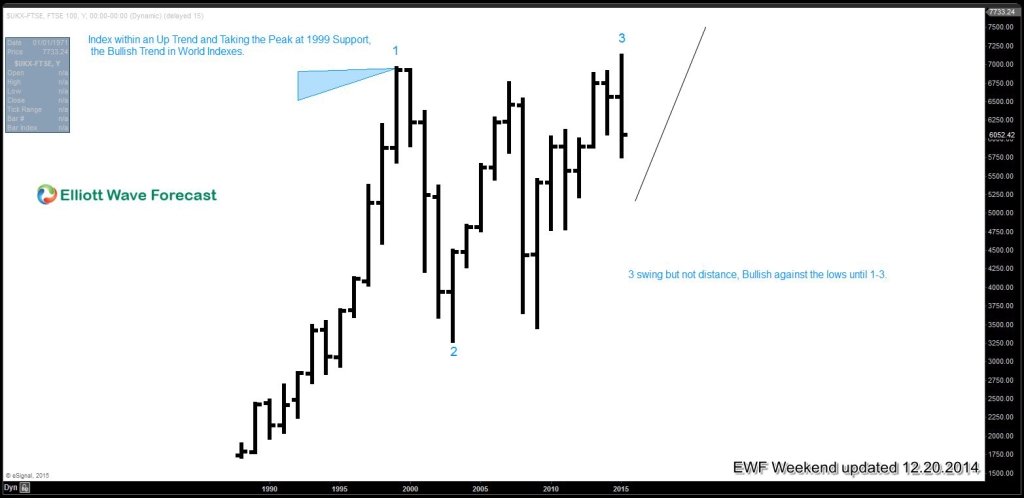
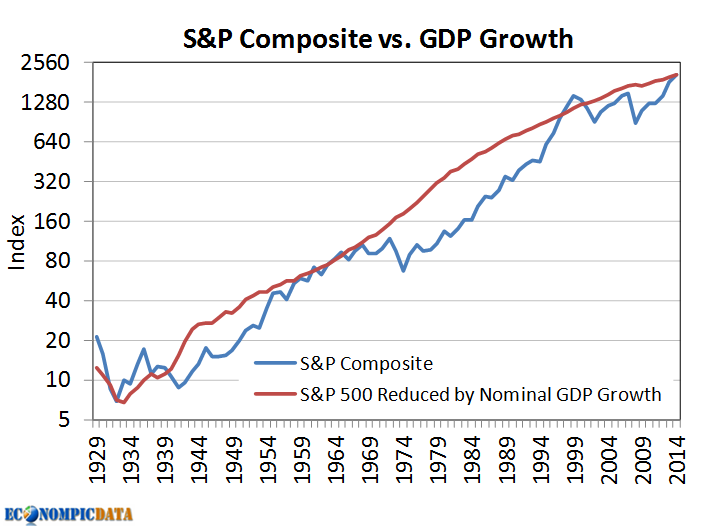
The following charts show the direct correlation between the World Population, the US GDP and also the $SPX chart,all showing the same trend which means it is better to think in buying dips than picking the tops. See how the population, GDP and Indices have gone up exponentially since 1950’s. We would also like to draw attention to the FTSE chart ($UKX-FTSE) which clearly shows an incomplete structure from the all-time lows and any dips should remain supported against 2003 lows until we don’t see market reaching levels where 3rd swing would be equal in length to the first swing marked on the chart. Assuming first swing started from 0 (zero) level, we would be looking at 10,000 area for 3=1 target. Also, take a look at $SPX chart which we believe did an expanded Elliott Wave FLAT structure from the peak at 2000 to the low in 2009 and again has not reached the highlighted blue box on the chart which represents an extreme from all time lows. If Index does an ABC from all time lows, then it should end the cycle from all time lows between 2217 – 2583 and should then correct the cycle from all time lows or only from 2009 lows if it were to turn into a triple three structure (WXYZ) higher from all time lows. Let’s not forget an ABC could turn into a bullish nest as well as the Index could extend to 1.618 ext at 3175 if it were to take the form of a possible impulse. As we don’t know what degree of correction would follow from the blue box, we would treat the pull back from the blue box as yet another buying opportunity as far as the pivot at 2009 low remains intact. If the pivot at 2009 low gives up, that would suggest Index would correct the entire cycle from all time lows and would still be a buy after the larger pull back completes.
We want to be clear that corrections will happen and trend being up doesn’t mean that the Indexes cannot drop in a 3-7-11 swings. The idea is to understand the trend and position on the right side. Also, the idea is that when the dips happen understand that the right trade is the buying, the most profitable trade of the Human kind. Humans are winners and have proven over Centuries the need for growth and picking the tops in World Indexes is a contradiction of the Human Kind’s growth.
This Formula will always work i.e. Global Population (Greatest Individual growth) = Higher GDP = Higher World Indexes. Therefore, instead of looking for a crash, we view dips as a buying opportunity in 3, 7 or 11 swings in one degree or another and join the trend of Human Growth. As the number of Individuals grow, there is higher changes that bigger minds are born which lead to bigger discoveries and hence leads to Economic growth Due to this logic, we have seen the Planes, the Cruises, the biggest & tallest buildings, the computer revolution etc. All of this made possible the Growth in the GDP and consequently The World Indexes. It is simple the Population feeds the Individuals Geniuses that drive the Growth and Humans until the day that this logical formula is denied. The World Indexes will be always Bullish because they feed off Individuals Genius .
Image Source: wikipedia.com
Back