Vistra Corp., (VST) operates as an integrated retail electricity & power generation company in the United States. It operates through five segments like Retail, Texas, East, West & Asset Closure. It comes under Utilities sector & trades as “VST” ticker at NYSE.
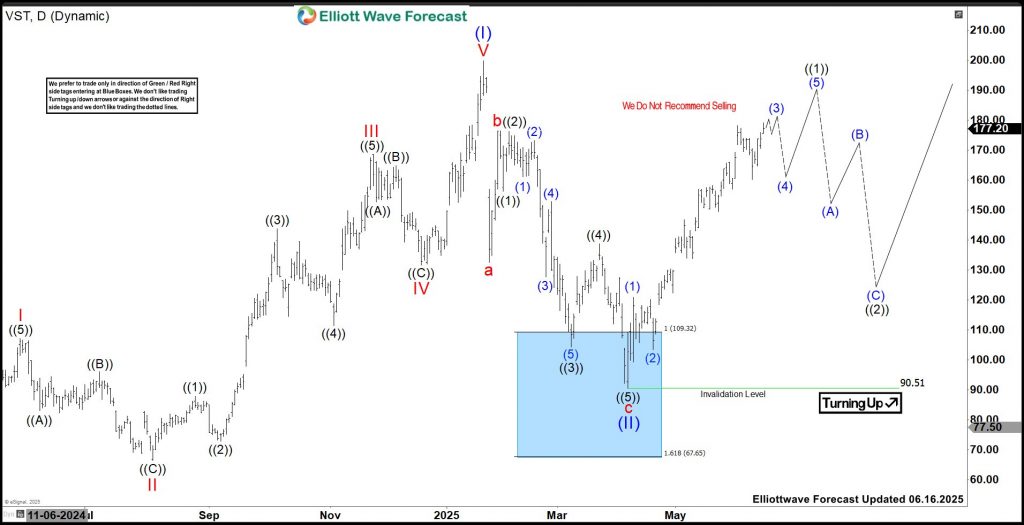
As discussed in the previous article, VST ended corrective pullback in blue box area & turned higher. It ended (II) pullback at $90.51 low, more than 50 % Fibonacci retracement of (I). Above there, it favors rally to new high in bullish sequence, which confirm above $199.84 high. Buyers are profitable & risk free as it rallied more than 60 % from the entry level.
VST – Elliott Wave Latest Daily View: 
In Weekly, it made all time low of $11.30 in March-2020. Above that it ended impulse sequence of (I) at $199.84 high in January-2025. Within (I), it placed I at $107.24 high in May-2024 & II at $66.50 low as 0.382 Fibonacci retracement in August-2024. It ended III at $168.67 high in November-2024 in clear 5 swings & IV at $131.64 low in December-2024. Within III, it placed ((1)) at $87.89 high, ((2)) at $72.90 low, ((3)) at $143.87 high, ((4)) at $111.50 low & ((5)) at 168.67 high. Above IV low, it placed V at $199.84 high as (I) impulse.
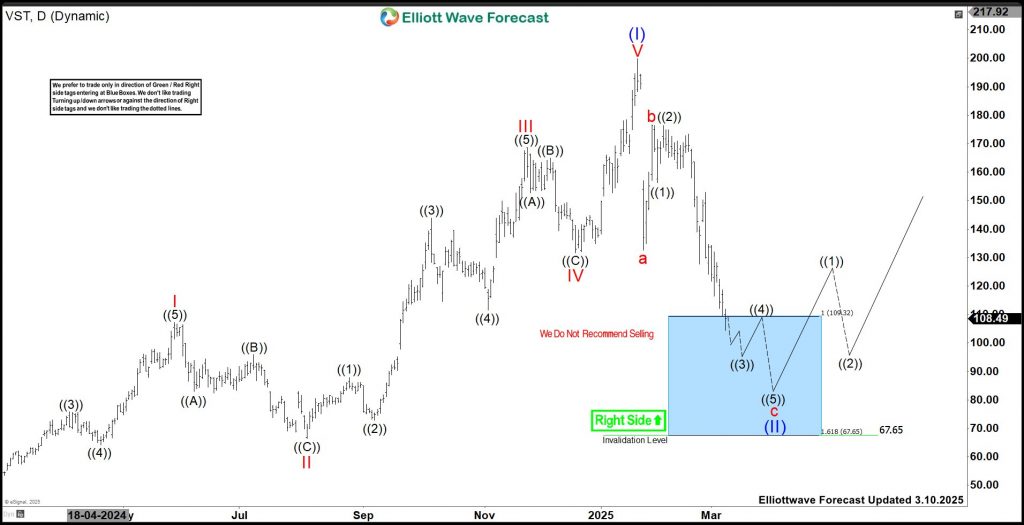
VST – Elliott Wave View From 3.10.2025: 
Below $199.84 high, it corrected lower in (II), which ended in daily blue box area at $90.51 low. Buyers from blue box area now having risk free long position as reacted higher. It placed a at $156.93 low in January-2025, b at $176.49 high & c at $90.51 low. The pullback is simple zigzag correction expected in previous article. Above (II) low, it favors rally in ((1)) & expect further upside before correcting in ((2)). It placed (1) at $120.96 high, (2) at $103.34 low & favors upside in (3), which can extend between $182.78 – $189.79 area before correcting in (4). Once it finishes the 5 swings in ((1)), it expects pullback in ((2)) in 3, 7 or 11 swings, which provides next buying opportunity at extreme area against April-2025 low.
Elliottwave Forecast updates 1-hour charts four times a day & 4-hour charts once a day for all our 78 instruments. We do a daily live session, where we guide our clients on the right side of the market. In addition, we have a chat room where our moderators will help you with any questions you have about what is happening in the market at the moment. You can try us for 14 days for only $9.99.
Back
