There has been good news lately within the Uranium industry. Japanese Prime Minister Fumio Kishida has said that they want to have as many as nine nuclear reactors operating this winter. Many of Japan’s nuclear reactors have been idle due to the Fukushima incident in 2011. However, rising fuel prices, surging inflation, and unstable power supplies due to war in Ukraine have changed the situation. South Korea has also restarted construction of two reactors.
Germany may also extend the life of its three remaining nuclear power plants as it faces gas crisis. Falling gas supplies from Russia through Nord Stream 1 pipeline has created a fear for the coming energy crisis in the coming winter. Uranium and Uranium Miners have reacted well lately but the overall market however remains risk off due to the hawkish Fed and aggressive rate hike. The Elliott Wave view outlook below suggests further downside still can’t be ruled out.
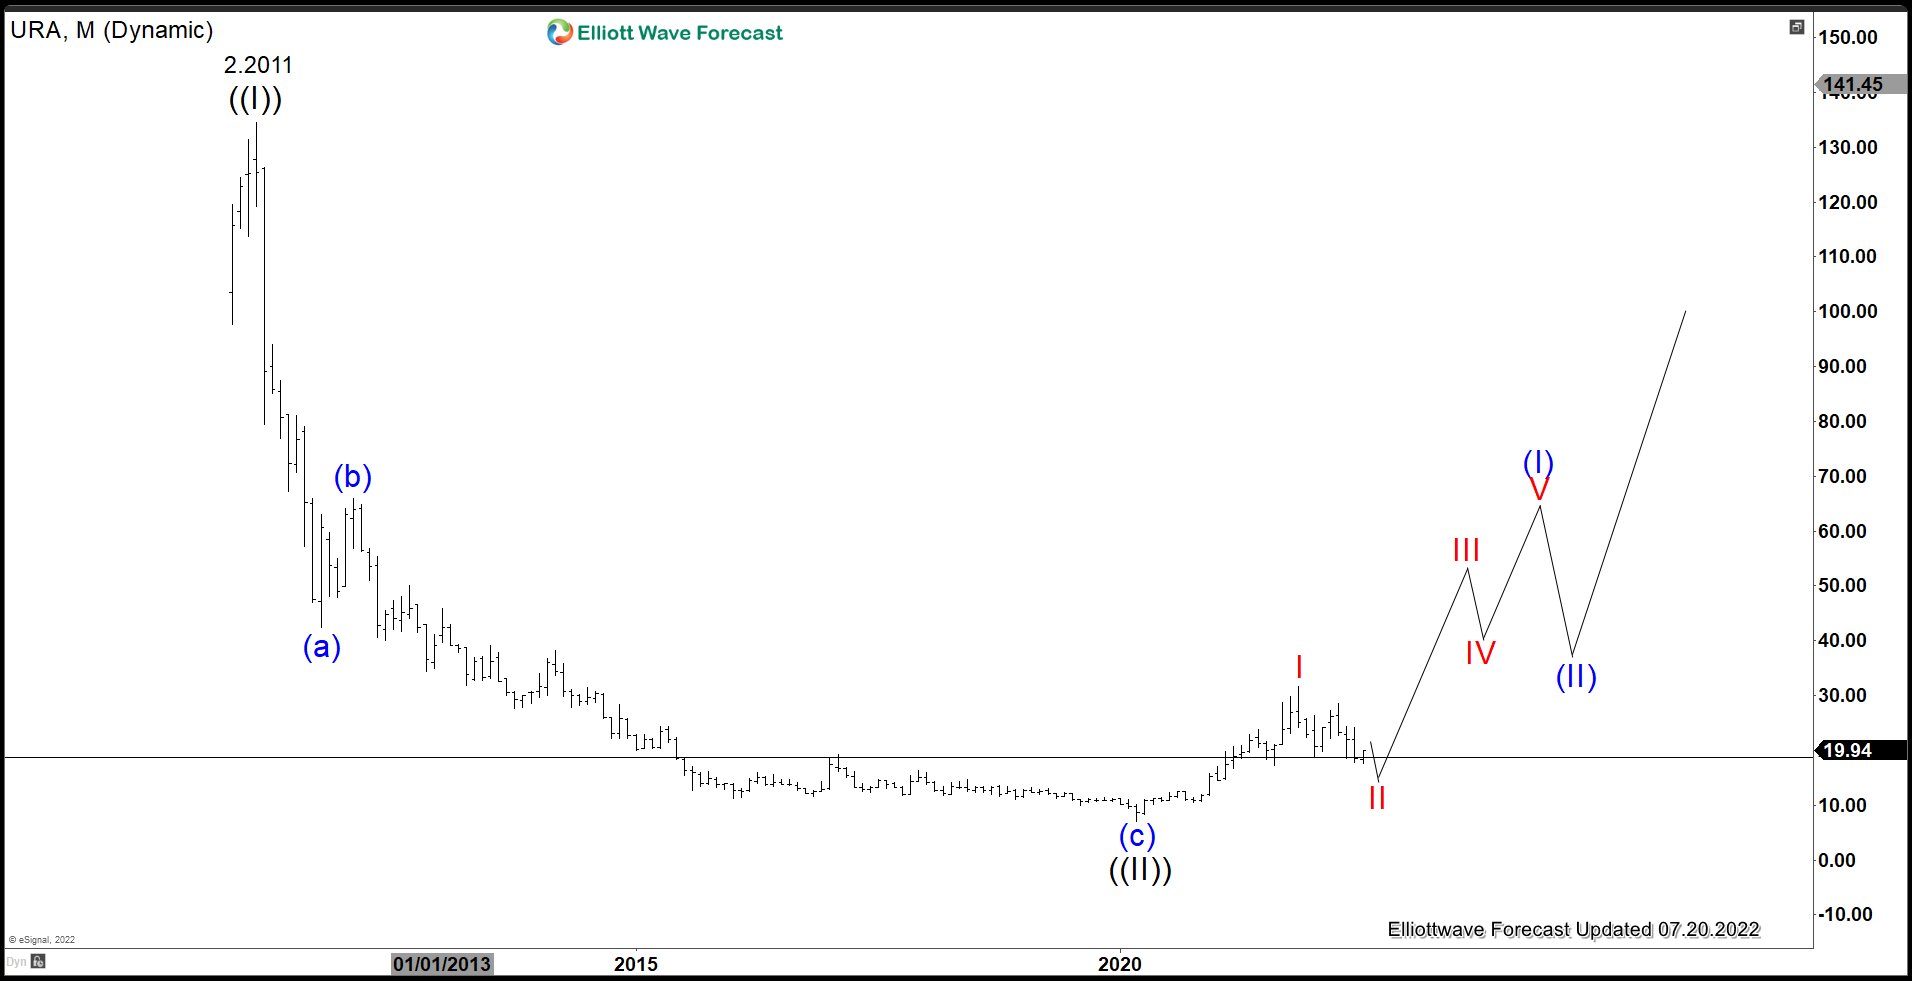
URA Monthly Elliott Wave Chart
 Monthly Elliott Wave chart of Uranium Miners ETF (URA) above suggests that the ETF is correcting the rally from wave ((II)). It has touched the horizontal support line around $20 but as we will see in the daily chart below, it has not fully reached the ideal 100% from 11/9/2021 peak. As a result, we still can’t rule out another leg lower before wave II correction is completed and then the ETF can resume the next bullish cycle.
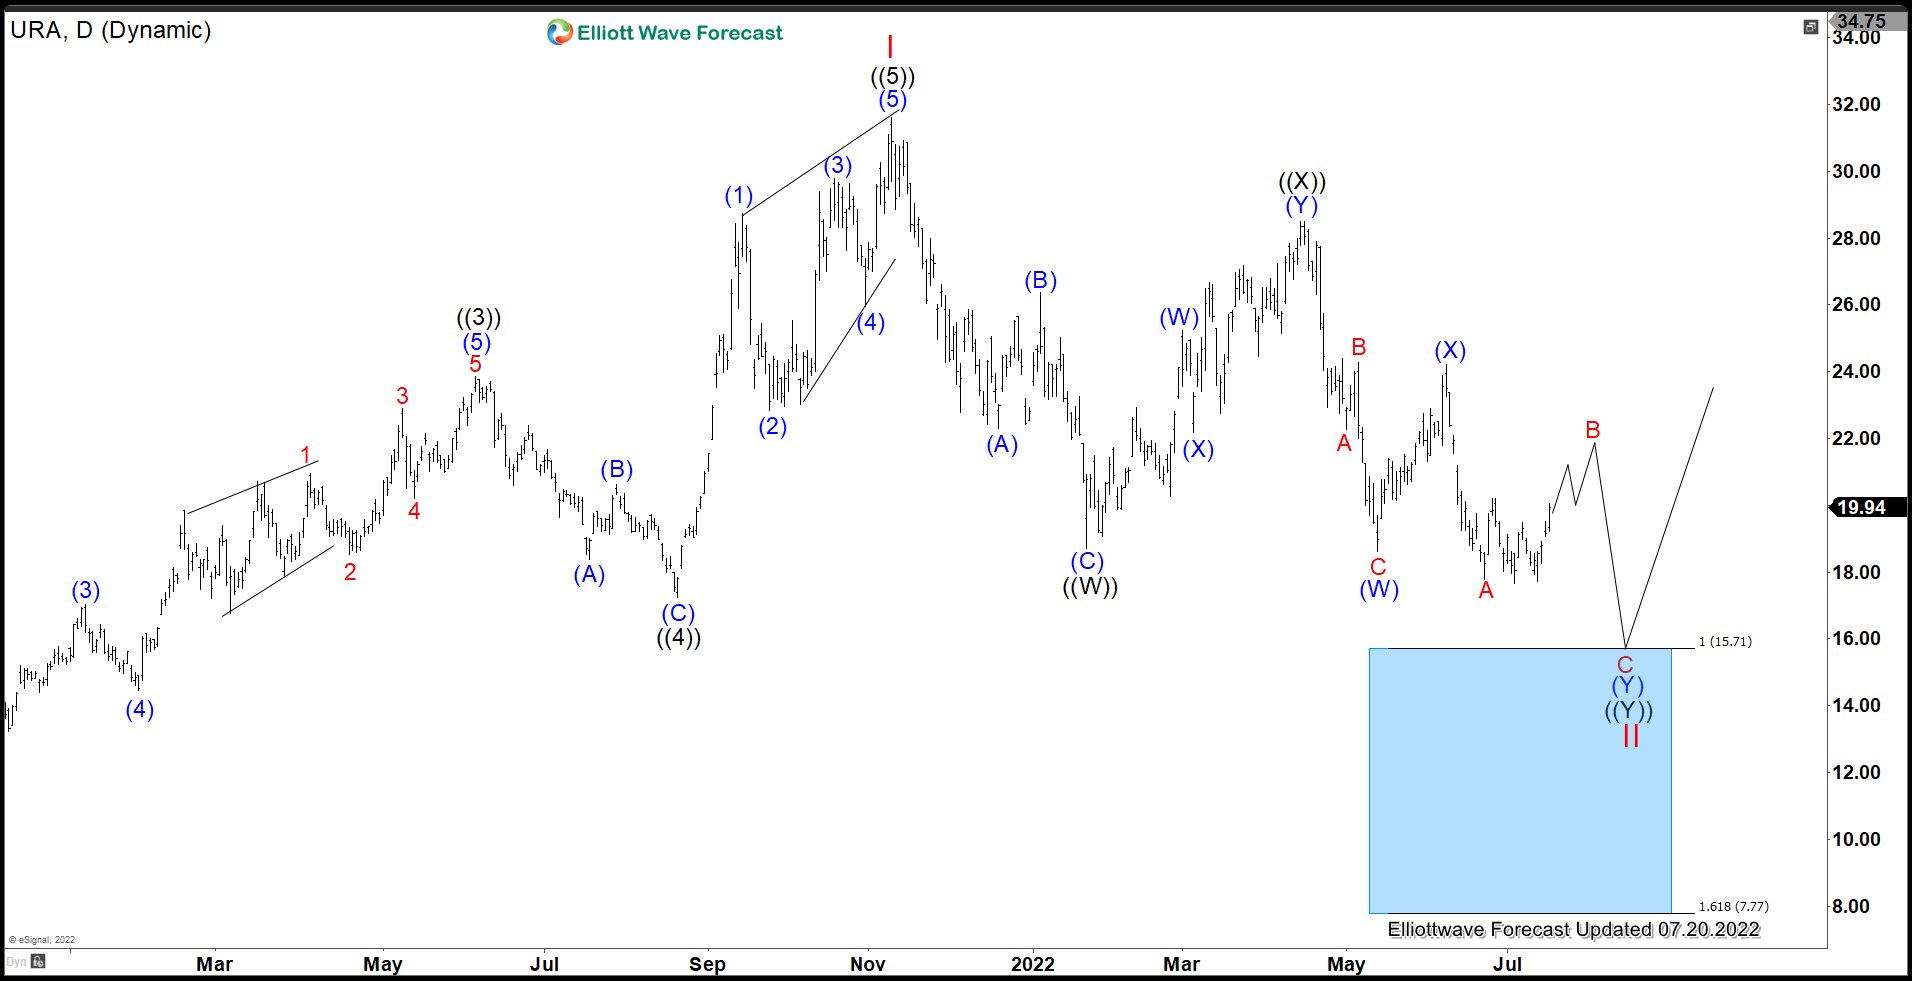
URA Daily Elliott Wave Chart
 URA Daily Elliott Wave View above shows that cycle from 11/9/2021 peak has not reached the ideal 100% extension at $15.71. Structure of wave II decline is unfolding as a double three Elliott Wave structure. Down from wave I, wave ((W)) ended at 18.71 and rally in wave ((X)) ended at 28.49. Expect the ETF to extend lower towards $7.77 – $15.71 area to complete wave II before the rally resumes.
Take our Trial to see our forecast on various stocks, Indices, forex, commodities, and cryptocurrencies here –> 14 days Trial
Back


