Starbucks (NASDAQ: SBUX) is American coffeehouse chain and it’s also the 3rd largest fast food restaurant chain by number of locations around the world. The coffee giant boosted sales by the end of the 2018 and its revenue and earnings beat expectations for the second consecutive quarter.
2018 was a red year for the stock market, as the majority of stocks suffered an average 30% – 40% by the end of the year. However SBUX managed to close the year with a positive number +11% among few other stocks in the consumer discretionary sector.
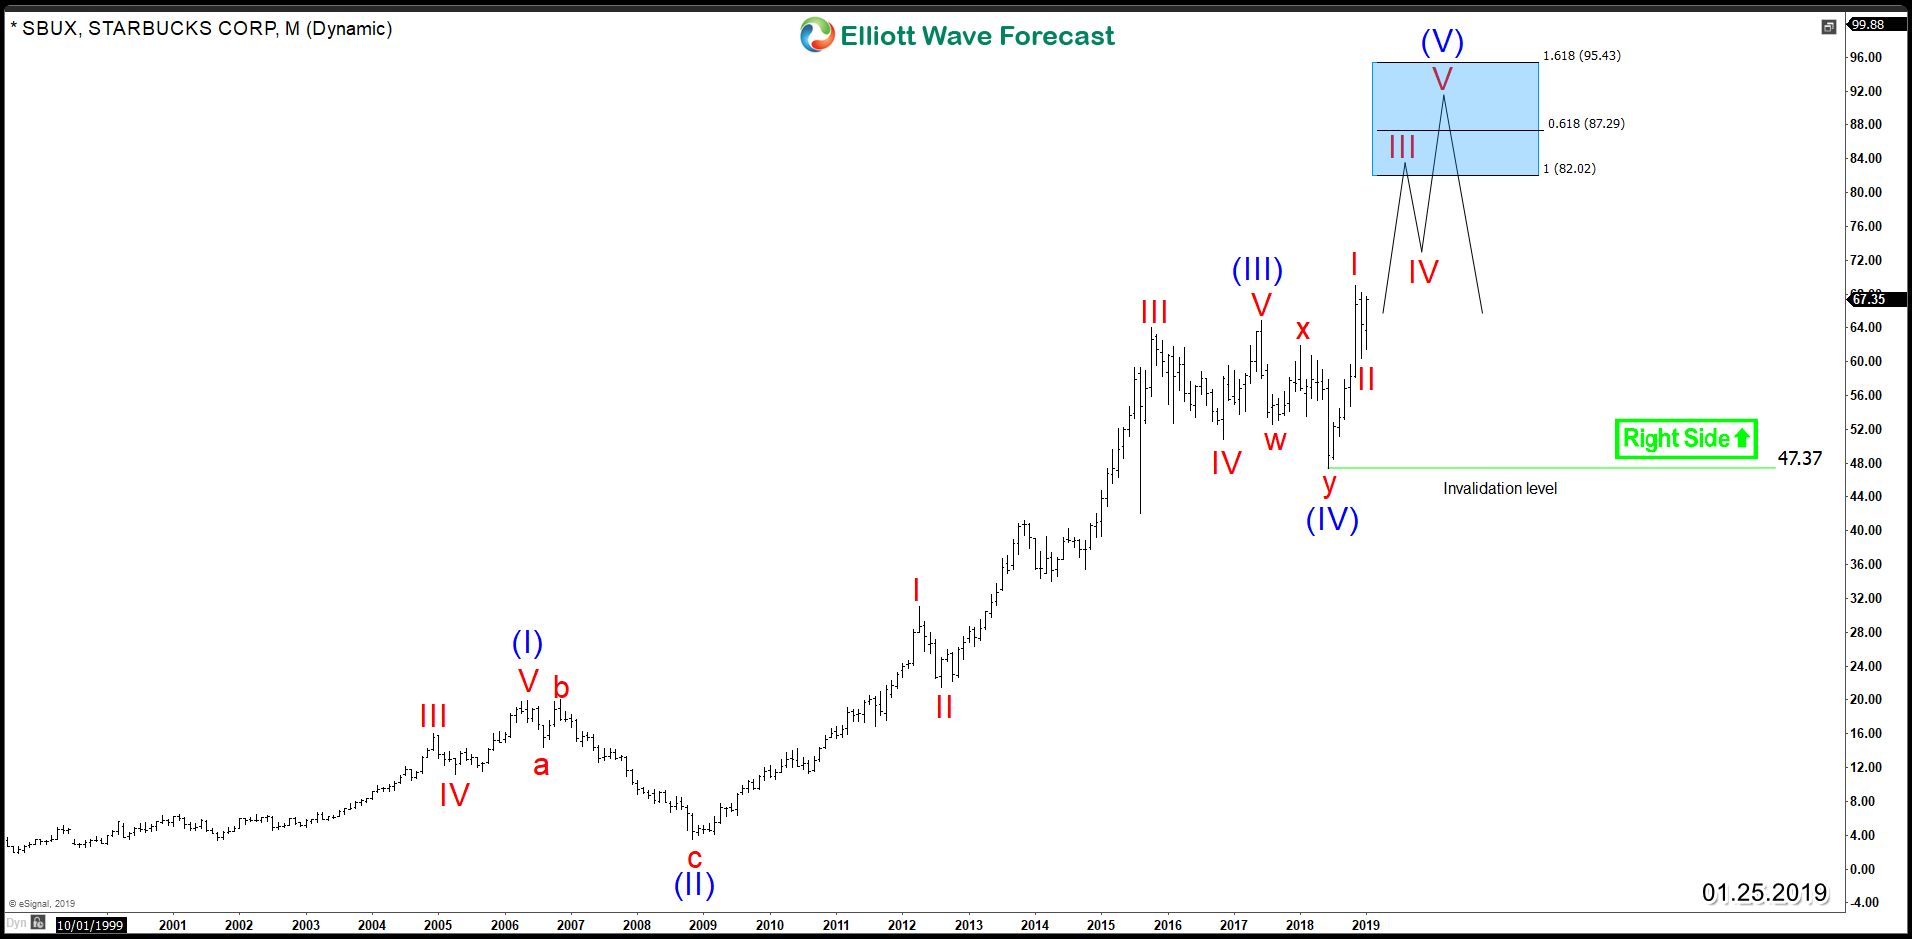
The long term technical chart for SBUX using the Elliott Wave Theory is showing a clear bullish structure. It’s doing an impulsive 5 waves move in the Super Cycle from IPO and it entered in the 5th wave territory which is the last wave to the upside before a larger correction takes place. The minimum target for the 5 wave was already reached last year at $68 which represent the measurement of wave ((I)) = to wave ((V)) but the extended measured target 61.8% of a combined wave ((1))+((3)) comes at $87 isn’t yet met.
Starbucks SBUX Monthly Chart
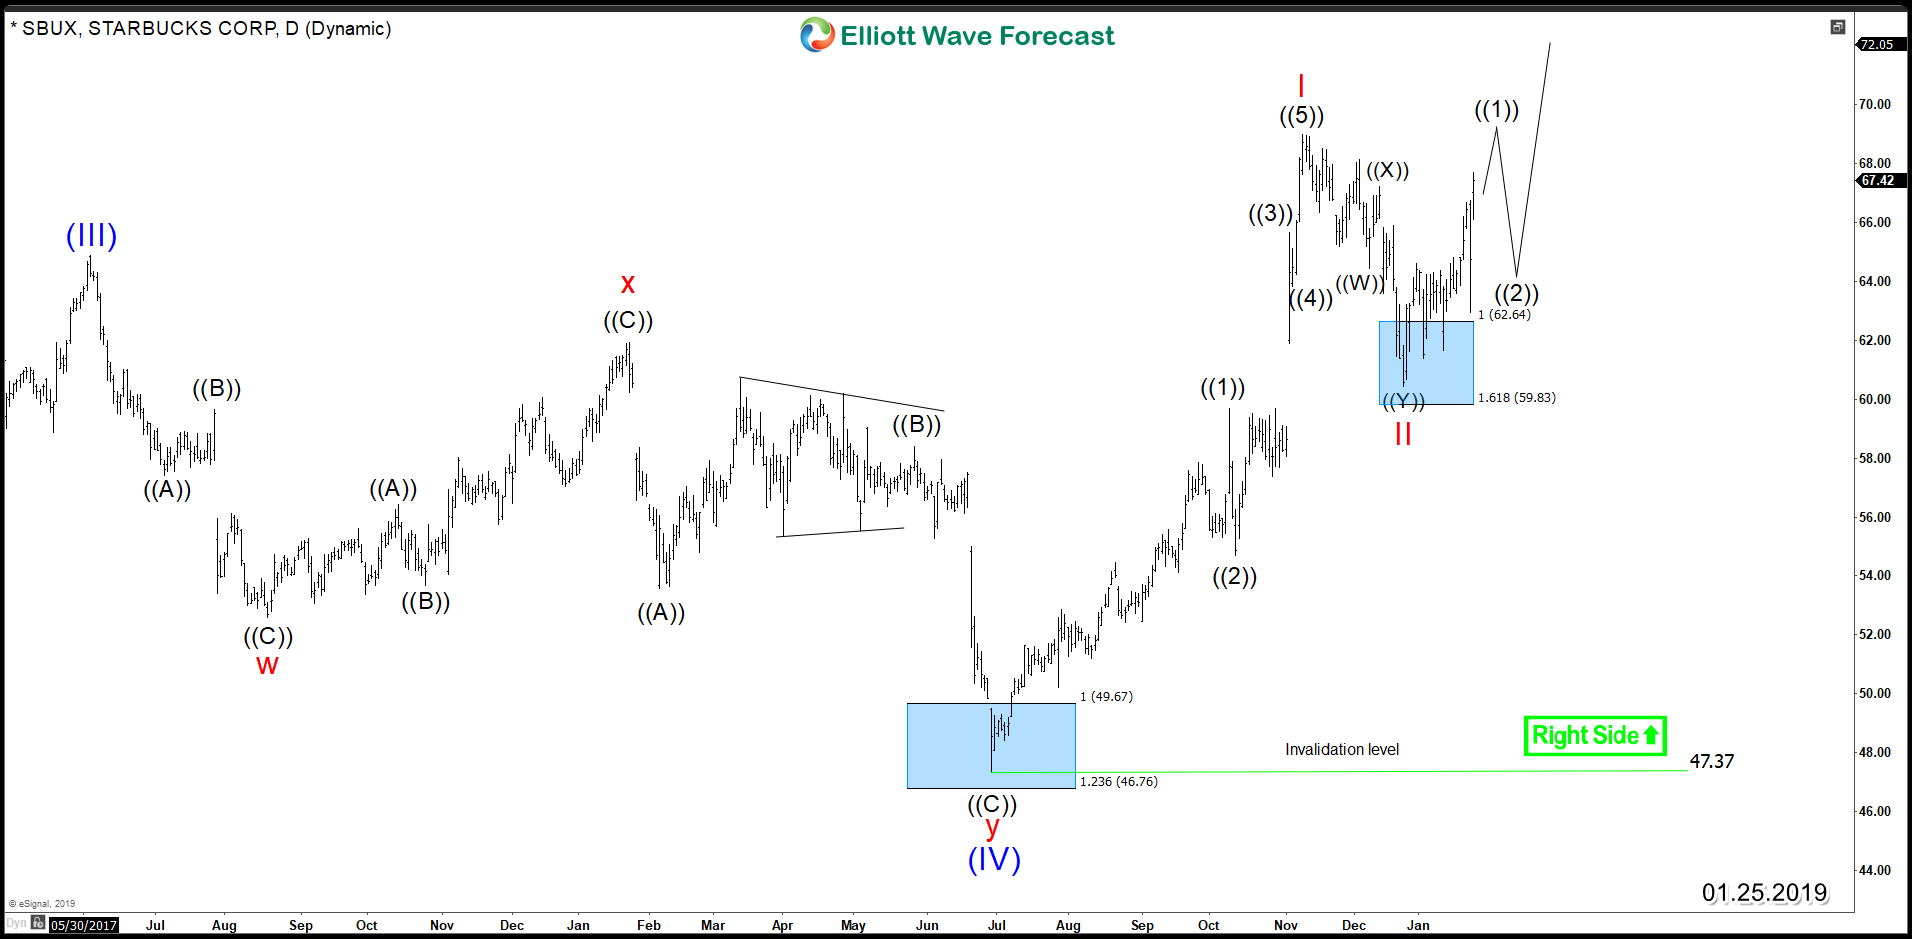
Last year, SBUX provided a good buying opportunity during its wave ((IV)) pullback as the stock did a 7 swing correction (Double Three). It reached the measured target at the blue box area $49.6 – $46.7 from where it resumed the rally to new all time highs with the recent peak in November 2018. Therefore, the stock is expected to remain bullish as long it remain above June 2018 low $47.37.
In the short term, the stock will have 2 possible paths to take place: The aggressive bullish scenario at this stage is having wave II in place as the stock already did 3 swing pullback into blue box area $62.64 – $59.83 and it already started the move higher in wave III with a target to the upside at $81 – $95 area. The second scenario suggest that while the current bounce fail below November peak $68.9 then wave II is still in progress and it can do the double correction lower into 50% area $58 before buyers show up again to resume the rally or bounce in 3 waves at least.
Consequently, the technical picture for Starbucks remain bullish as the stock is aiming for new all time highs and leading the move higher along side few other stock against 2018 low.
Starbucks SBUX Daily Chart
Get more insights about the Consumer Discretionary Sector by taking this opportunity to try our services 14 days for Free and learn how to trade Stocks and ETFs using our blue boxes and the 3, 7 or 11 swings sequence. You will get access to our 78 instruments updated in 4 different time frames, Live Trading & Analysis Session done by our Expert Analysts every day, 24-hour chat room support and much more.
Back


