Starbucks (NASDAQ: SBUX) is currently up 50% year-to-date and remains as one of the strongest stocks leading the bull market higher and making new all time highs.
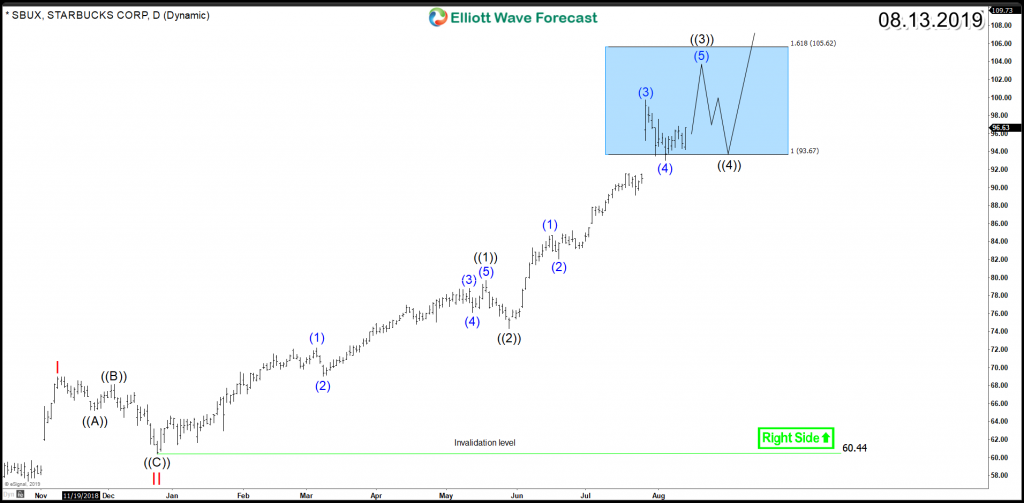
the stock is currently trading within an impulsive 5 waves advance which started since December 2018 and it reached the minimum target area at equal legs $93.6 – $105.6. However, the cycle remains in progress as long as May 29th pivot is holding and further extension higher can take place before ending wave ((3)) followed by a 3 waves pullback in wave ((4)) then another rally in wave ((5)) to finish the cycle from $60.44 low.
SBUX Daily Chart 08.13.2019
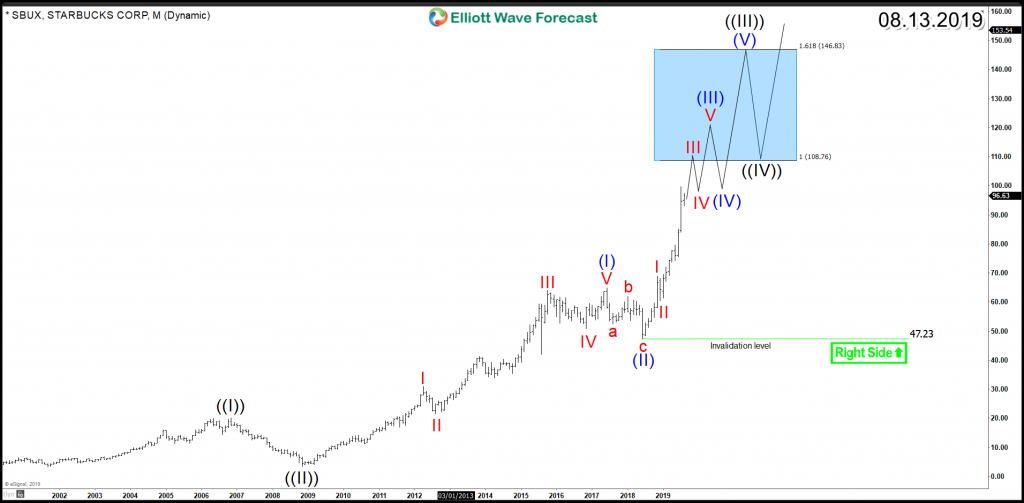
SBUX rally from 2018 low is part of wave (III) of the super cycle that started since 2008 and looking for the a multi-year target around $108 – $146 from where larger correction can be expected to be seen. Consequently, the stock bullish trend will remain supported for the coming few months making new all time highs and traders should be aware of the potential corrections that could take place every time it hits a target area.
SBUX Monthly Chart 08.13.2019
In Conclusion, Starbucks has a bullish Elliott Wave structure that would present buying opportunities in any 3 or 7 swings pullbacks to allow investors to join the strong bull market rally.
Get more insights about Stocks and ETFs by taking this opportunity to try our services 14 days for Free and learn how to trade Stocks and ETFs using our blue boxes and the 3, 7 or 11 swings sequence. You will get access to our 78 instruments updated in 4 different time frames, Live Trading & Analysis Session done by our Expert Analysts every day, 24-hour chat room support and much more.
Back


