$SPY made a sharp decline last week and our members knew that the decline was corrective and it was another opportunity for buyers to enter the market to resume the rally for new highs or produce a larger 3 waves bounce at least. In this article, we would look at the forecast from last week and this week to see how SPY price action unfolded and also look at the way it reacted from our blue box extreme area. Blue Boxes are High-Frequency areas which are based in a relationship of sequences, cycles and calculated using extensions.
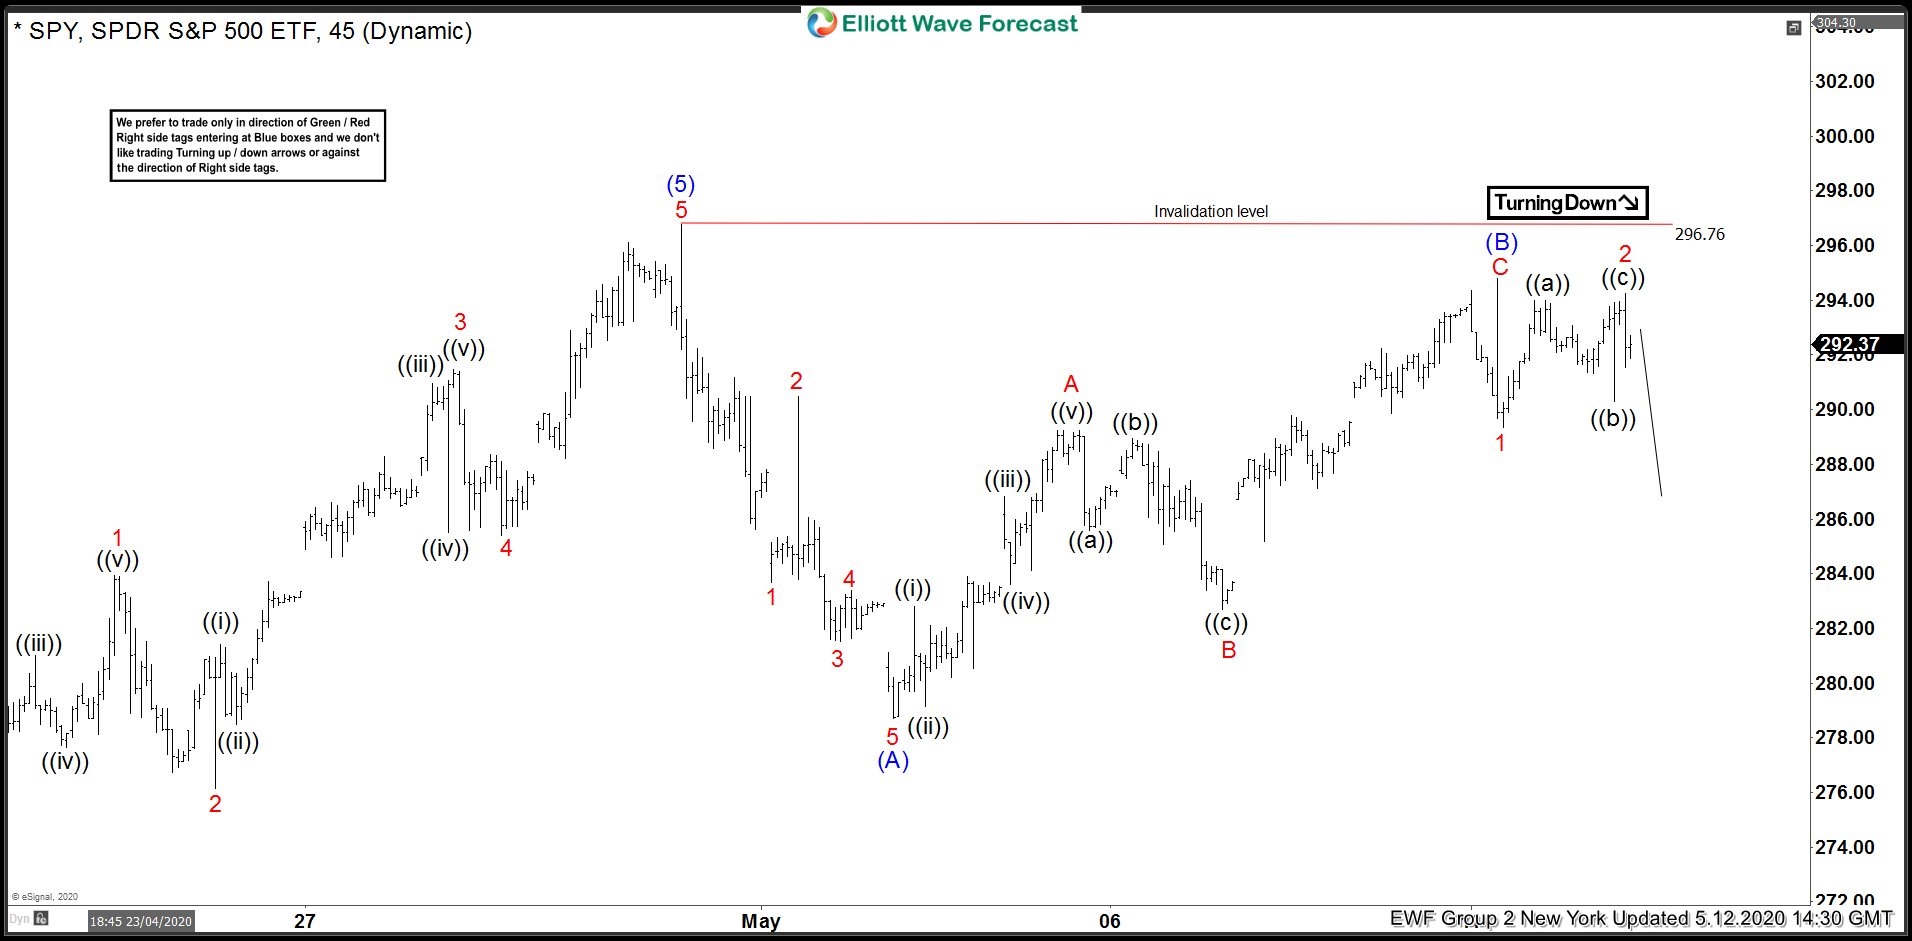
SPY 12 May 1 Hour New York Elliott Wave Update
Decline from April 30 high (296.76) was in 5 waves and ended at 278.69 on 4th May. We labelled this wave (A) and 3 waves bounce to 294.80 on 11th May was labelled wave (B). Wave (B) reaction was quite deep but since we saw the decline from 296.76 high to 278.69 low to be in 5 waves, we stayed with our forecast of (C) leg lower before the rally resumes. Chart below is from May 12, New York update when we called SPY to extend lower within wave (C) down from April 30 high.
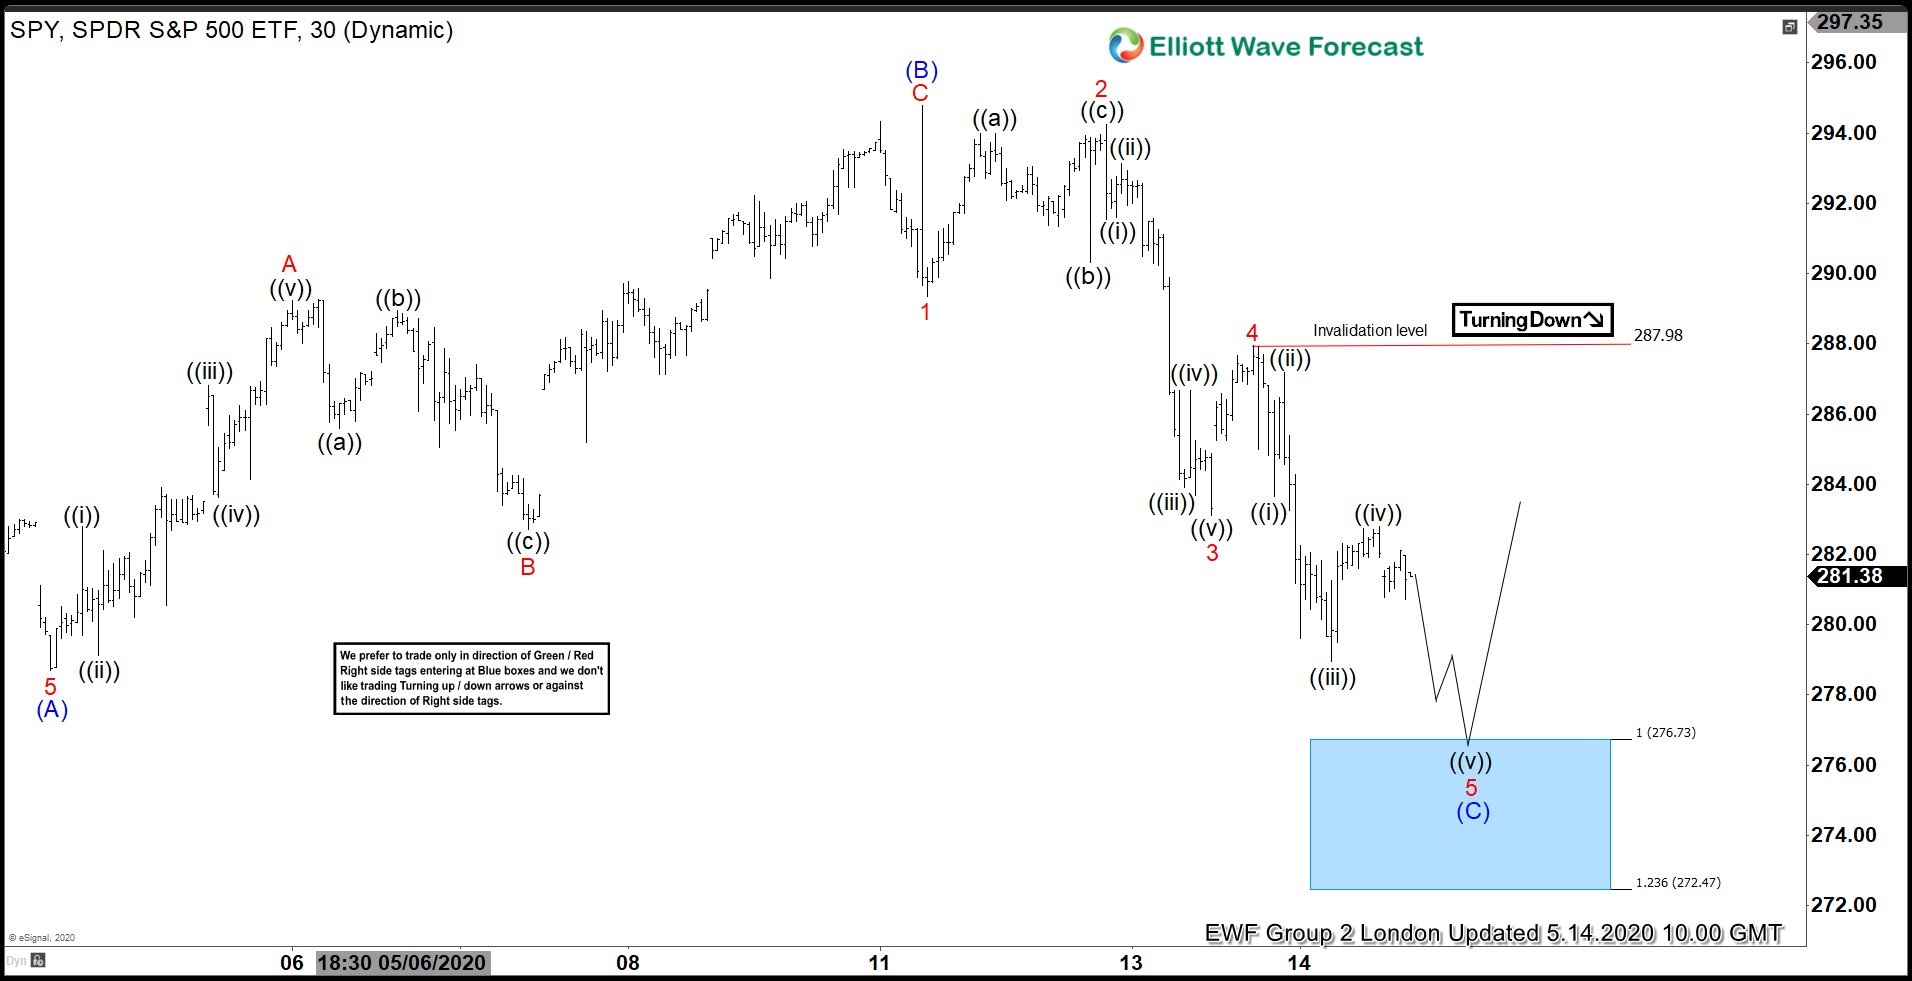
SPY 14 May 1 Hour London Elliott Wave Update
Two days later, we see SPY resumed the decline in wave (C) as expected and drop to 283.10 completed wave 3, whereas bounce to 287.98 completed wave 4 of (C). Chart below shows market already broke below wave 3 low suggesting wave 5 lower was in progress and expected to test blue box area between 276.73 – 272.47 and then turn higher.
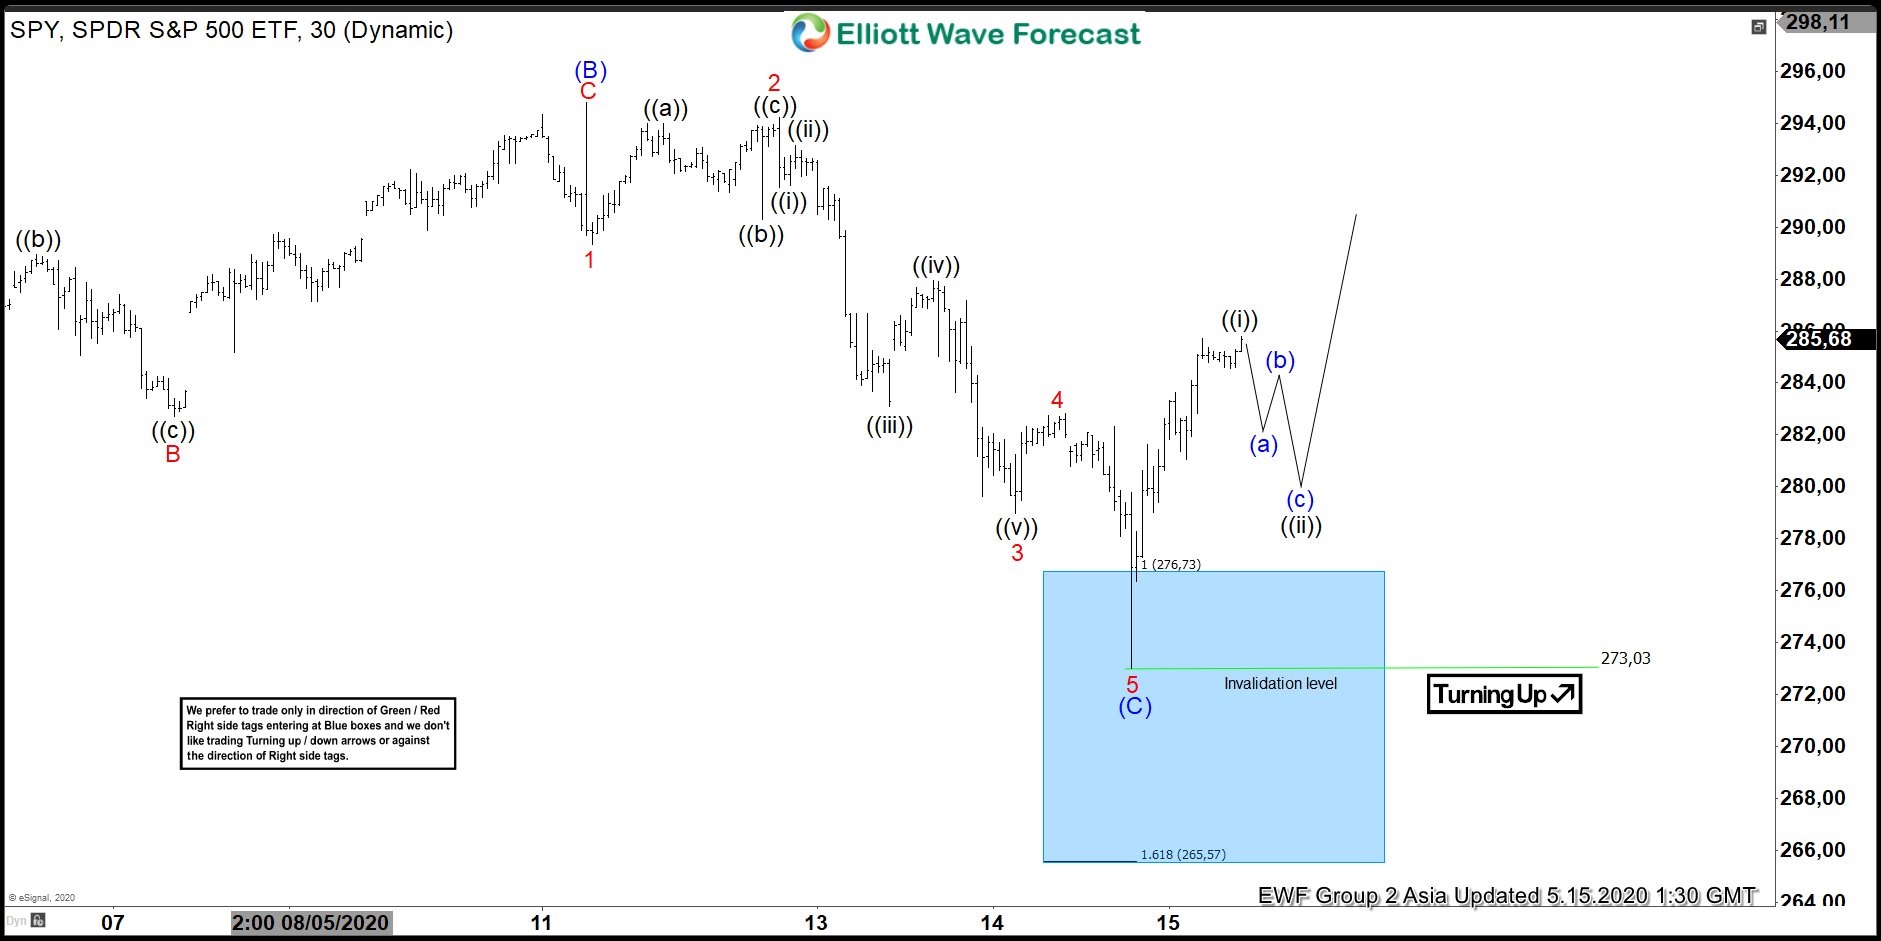
SPY 15 May 1 Hour Asia Elliott Wave Update
SPY reached the blue box where buyers were waiting and produced a strong reaction higher as could be seen in Asian update presented to clients on 15th May. Rally from the low 273.03 low appeared impulsive adding more conviction to the view that a zigzag Elliottwave correction ended at 273.03 and as pull backs held above this level, market should continue higher.
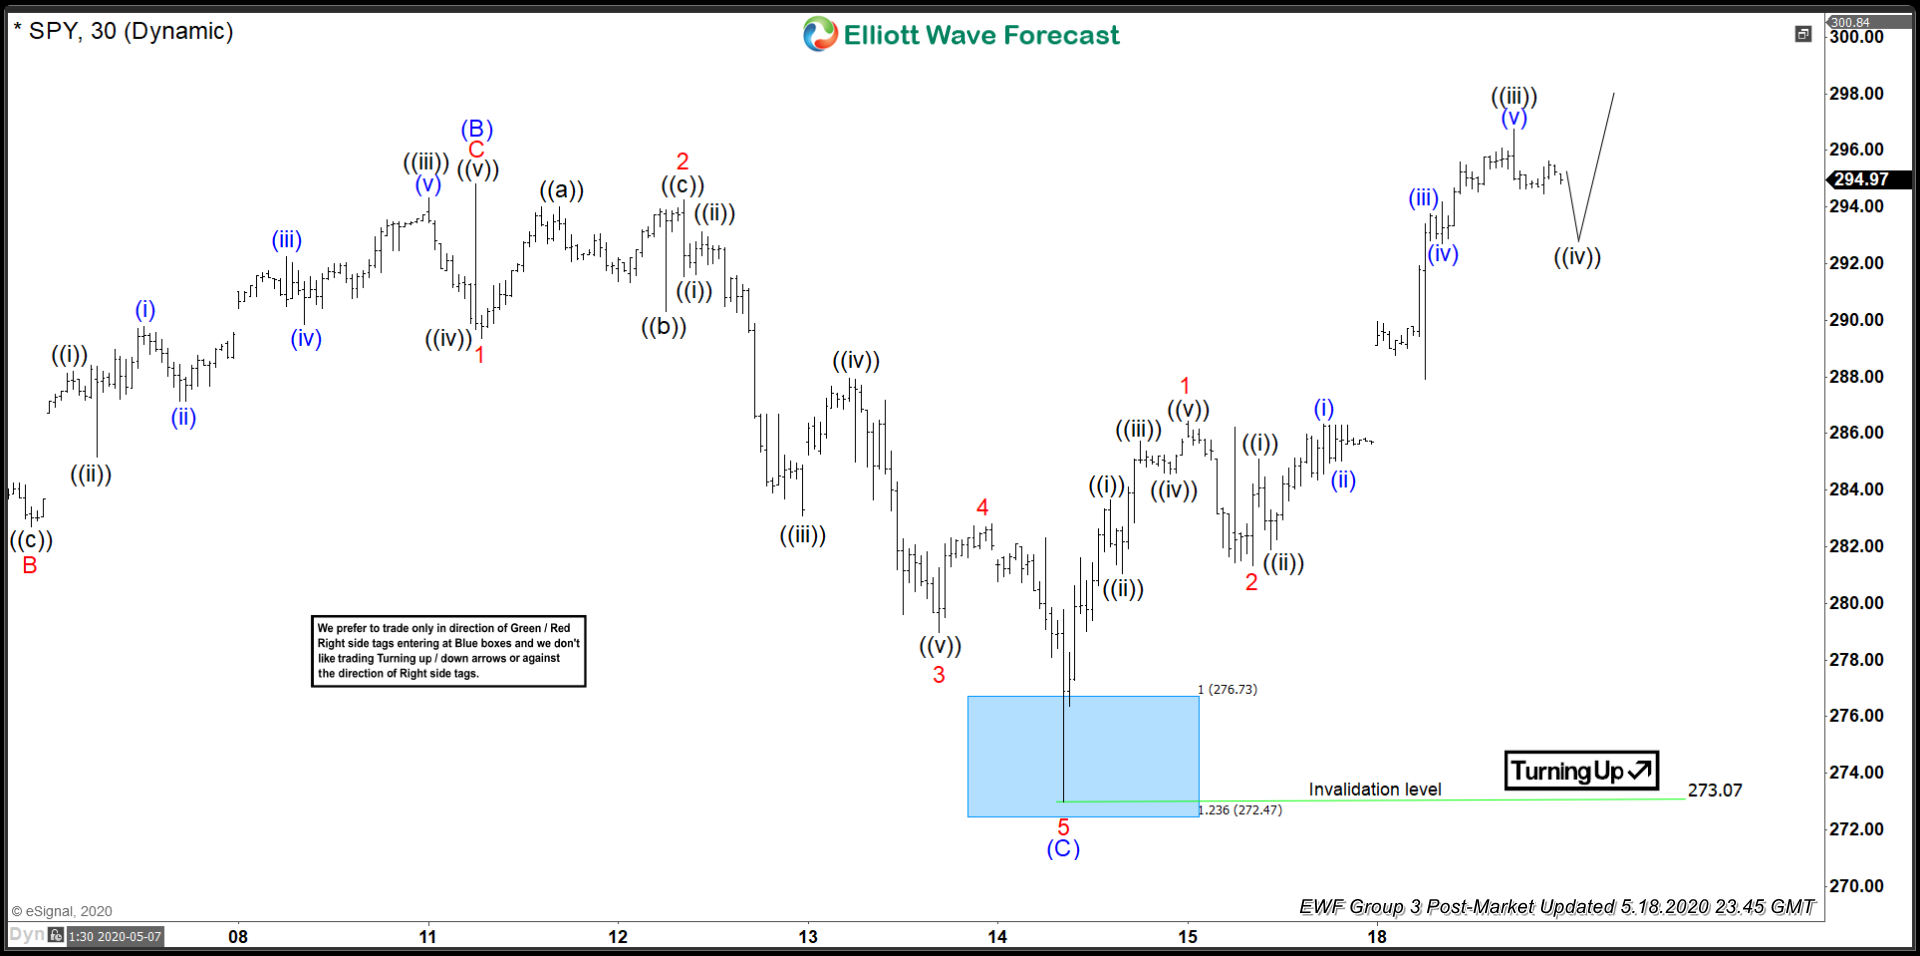
SPY 18 May 1 Hour Post Market Elliott Wave Update
Chart below shows the rally resumed as expected by the closing on the 18th, we had seen a full test of the peak on 30th April. However, based on gap and clear separation between wave ((i)) and ((iv)) within wave 3, we expected the rally to become an impulse with more upside to come.
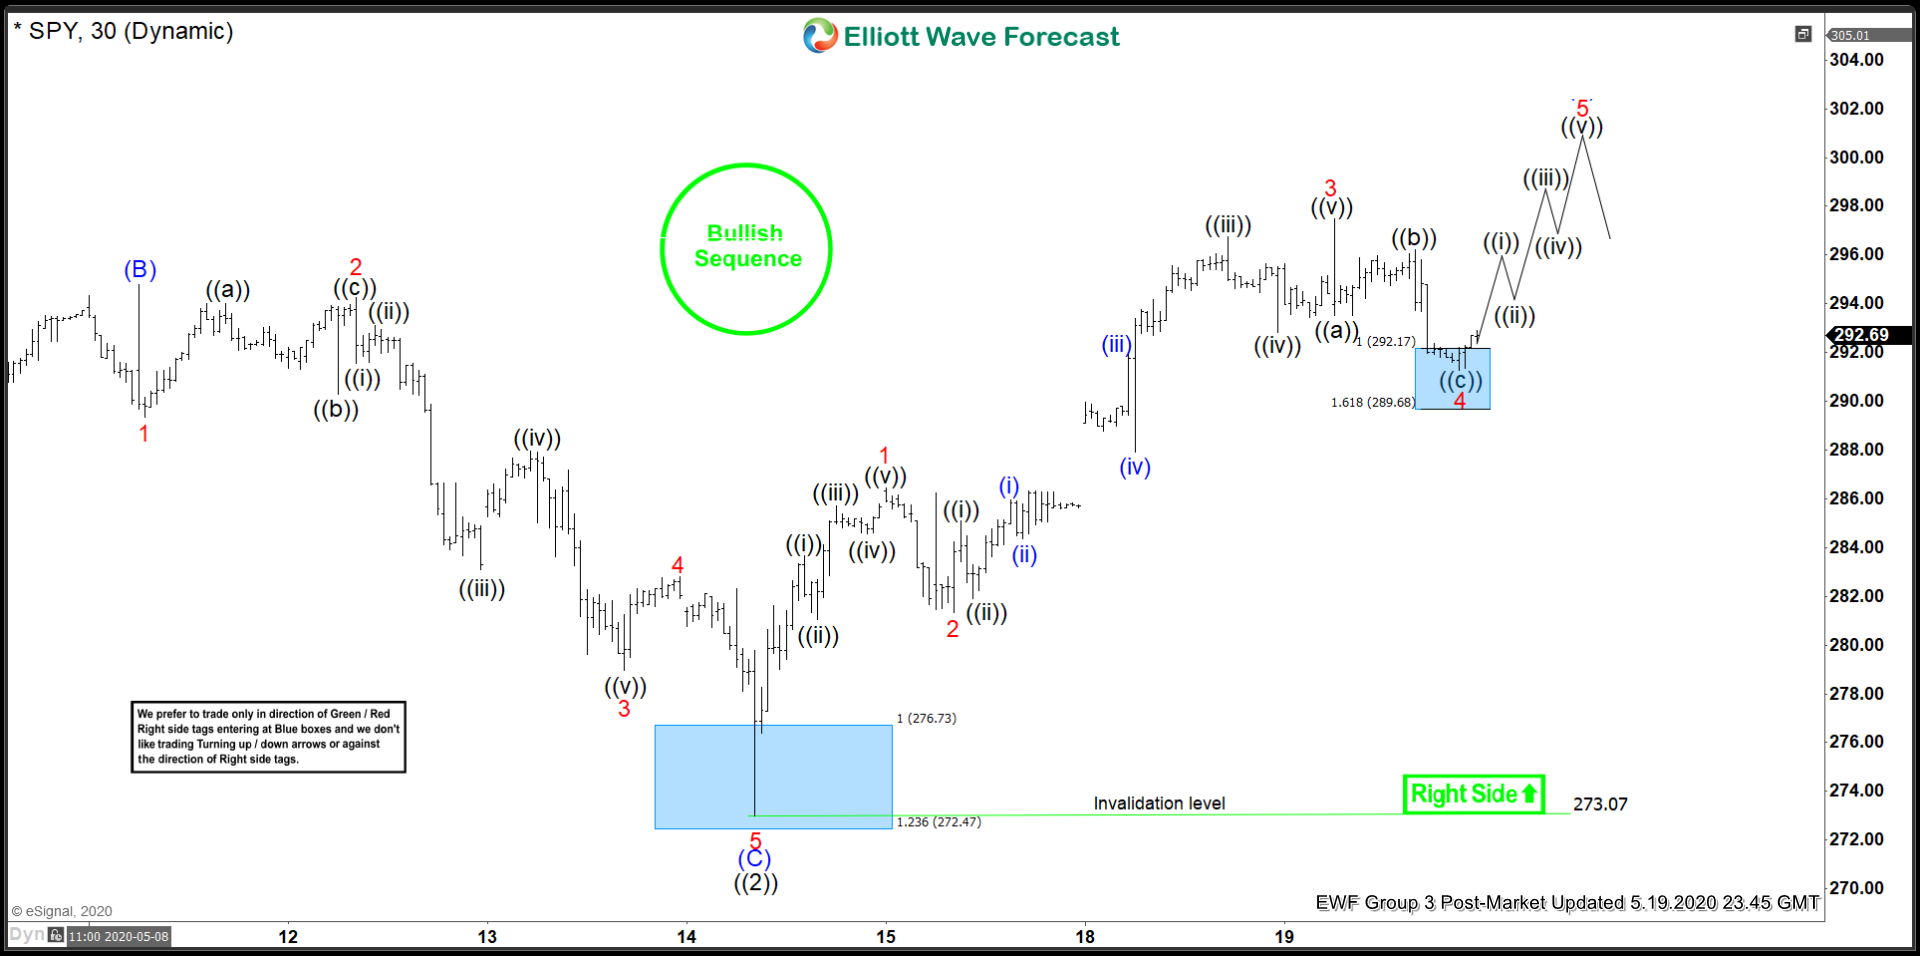
SPY 19 May 1 Hour Post Market Elliott Wave Update
SPY made a new high to complete wave 3 and then pulled back in 3 waves which reached another blue box area between 292.17 – 289.68 and we expected the rally to resume from this area in wave 5. Later on, we saw SPY breaking to new high and now showing 5 waves up from 273 low which is either complete or could still see some more extension as far as May 19 low remains in place.
Back