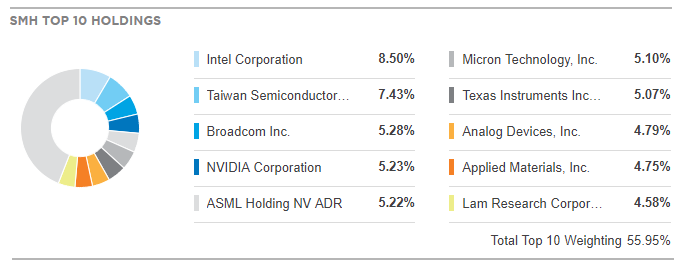
The VanEck Vectors Semiconductor ETF (SMH) tracks a market-cap-weighted index of 25 of the largest US-listed semiconductors companies. Such companies include foreign companies that are listed on a U.S. exchange like Taiwan Semiconductor Manufacturing (TSM: NYSE) and also big technology companies like Intel (INTC: NASDAQ) or Nvidia (NVDA: NASDAQ).
During this year, the Index made new all time high on 13 of March before started a correction to the downside.
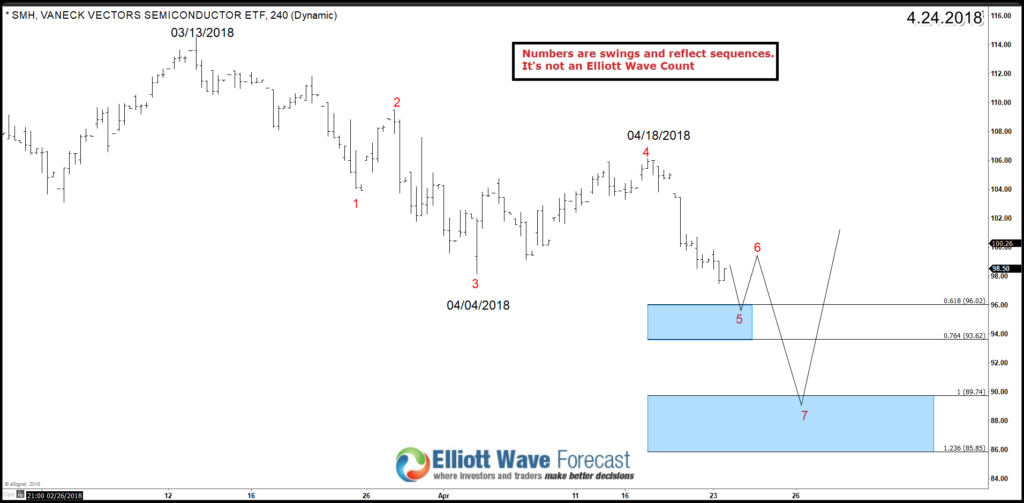
Taking a look at the 4H chart, we can notice that SMH finished the first 3 swings lower on 4th of April followed by a short term bounce that ended on 04/18. Down from there, the ETF managed to break the recent April low which allow us to count 5 swing from 03/13 peak. Consequently, the instrument is showing a 1 Hour incomplete bearish sequence from March peak and it’s suggesting more weakness toward the equal legs area $89.7 – $85.8.
The swings count reflect the sequence of the instrument and doesn’t represent an Elliott Wave Count. Based on the swings we can conduct that SMH is proposed to be doing a corrective double three structure ( 7 swings ) and after reaching the extreme blue box area, it’s expected to bounce higher in 3 waves at least.
SMH 4H Chart 04/24/2018
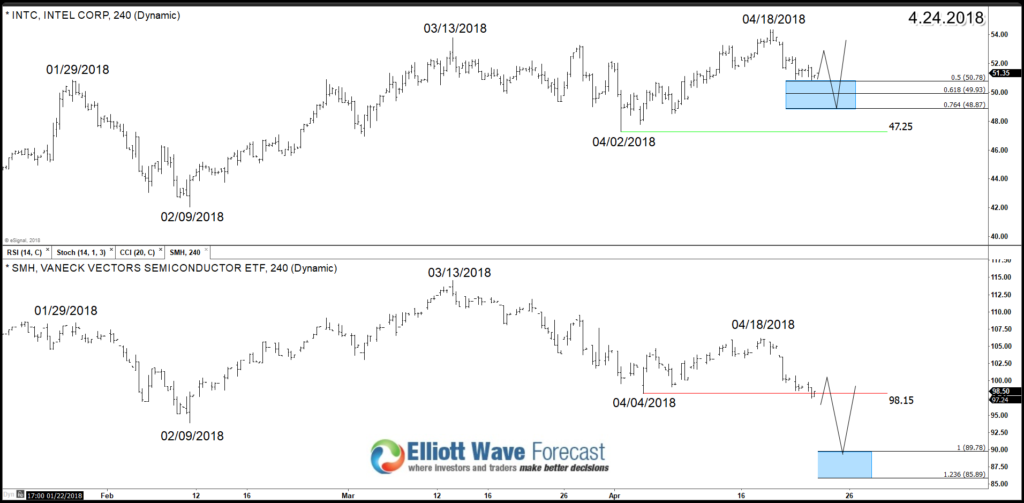
Comparing SMH to Intel Corporation (biggest allocation), we can notice that both instrument are sharing the same highs and lows despite having different structure which indicates they are trading the same swings. However, INC has an advantage over SMH as the stock did manage to break above March peak starting a new cycle to the upside while SMH is looking to do a larger degree correction.
INTC vs SMH Chart
Therefore, unless INTC is doing a flat from 03/13 peak then the current pullback from 04/18 should be able to hold above 04/02 which SMH already managed to break. Consequently, we can use the equal legs area of SMH to provide a floor for Semiconductor sector and find the right timing to buy its related stocks.
Conclusion
Semiconductor ETF SMH looking to finish 7 swings from March peak which will provide a bouncing area where buyers are expected to show up because we still believe the bigger picture in the stock market remain bullish and we favor the long side in 3 , 7 or 11 swings.
For further insights about Intel or other technology stocks then take this opportunity and try our services 14 days to learn how to trade Stocks and ETFs using our blue boxes and the 3, 7 or 11 swings sequence. You will get access to our 78 instruments updated in 4 different time frames, Live Trading & Analysis Session done by our Expert Analysts every day, 24-hour chat room support and much more.
Back


