$SMH Longer Term Bullish Cycles & Elliott Wave
Firstly as seen on the monthly chart shown below. There is data back to May 2000 in the ETF fund. Data suggests the fund made a low in November 2008 that has not been taken out in price. There is no Elliott Wave count on the monthly chart and mainly is highlighting the cycle highs and lows. I assume the June 2000 high at 105.75 would be an all time high at that point in time. From there into the November 2008 lows it corrected the all time bullish cycle. From the November 2008 lows to the June 2015 highs was a larger degree impulse. The August 2015 lows corrected that cycle. From there you can see another bullish cycle that appears to be an impulse into the March 2018 highs. Those were new all time highs at 114.55 that were above the June 2000 highs.
Secondly the highlighted area on the monthly chart is the Fibonacci extension of the move up from the November 2008 lows. The way these are measured is as follows. First, on a chart platform take the Fibonacci extension tool and begin at the November 2008 lows as point 1. Next up to the June 2015 highs will be point 2. From there down to the August 2015 lows will be the point 3. That will give the highlighted area shown on the chart. It appears this move is a larger degree wave 1 , 2 , 3 with the 4th wave likely in place in December 2018. Those March 2018 highs created a longer term bullish sequence. Next the analysis continues below the monthly chart.
SMH Monthly Chart
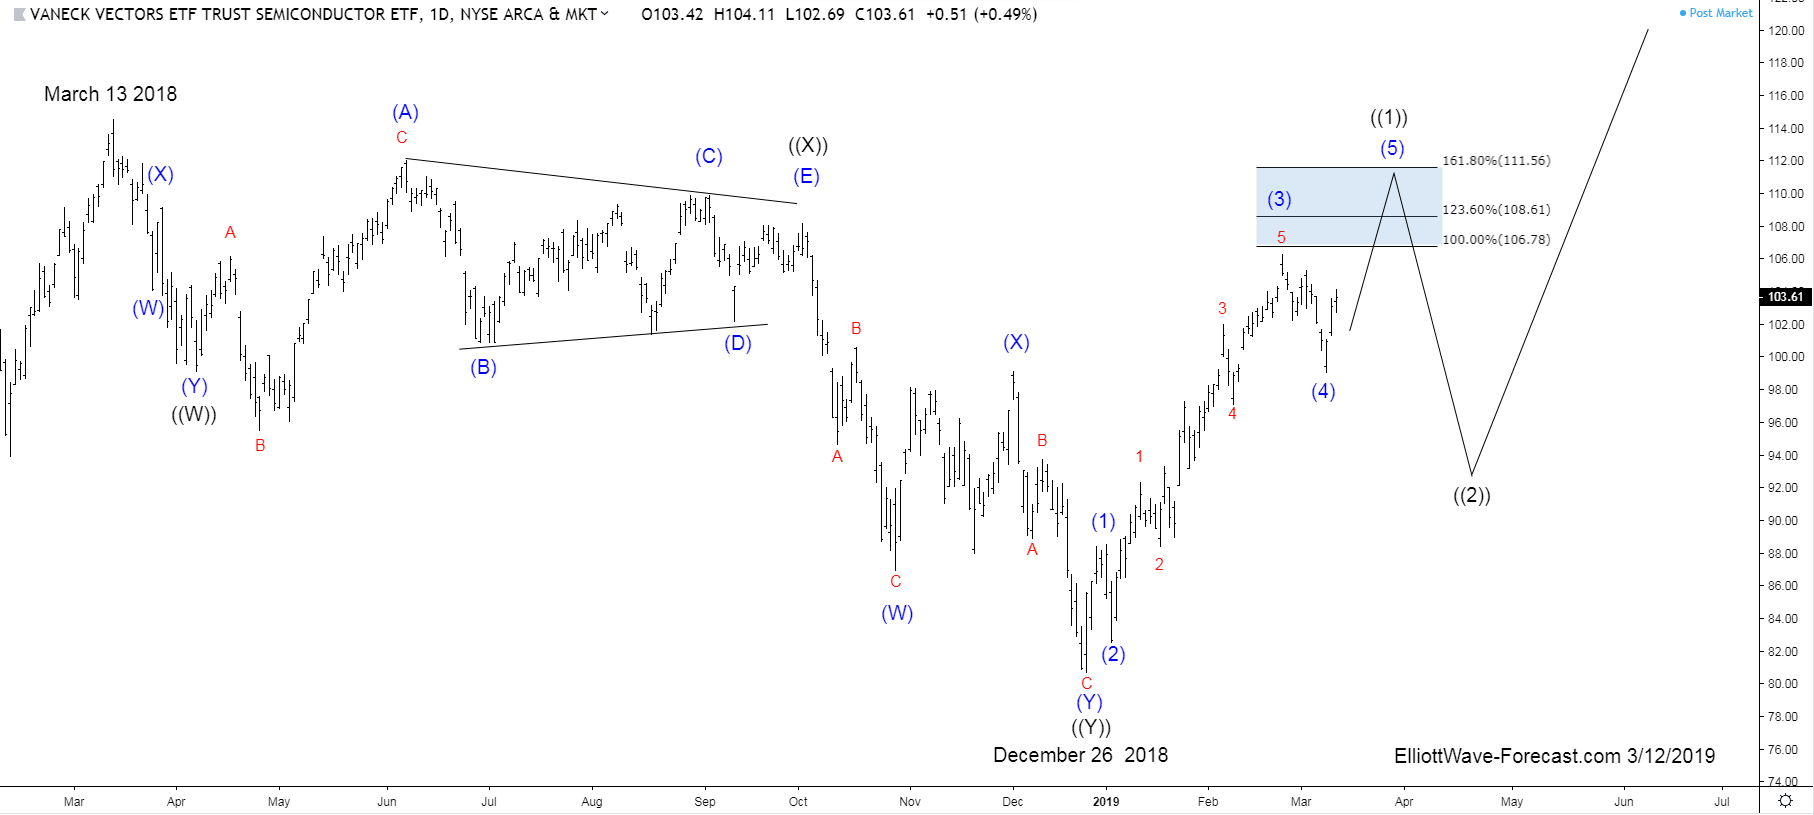
Thirdly as previously mentioned I think the move up from the November 2008 lows was impulsive with the wave 1, 2, 3 through 4 completed at the December 2018 lows. While above there, it will have to make new highs above the March 2018 highs in the 5th wave to confirm that. Until then there is the possibility of another swing lower under the December 2018 lows which at this time it is not preferred. Next, the Elliott Wave count from the March 2018 highs is where the daily chart below begins.
SMH Daily Chart
Lastly in conclusion from the March 13 2018 highs the SMH appears to have declined in three larger swings as shown in the labels. Firstly it does not appear to be an impulse as the largest correction is in the middle of the cycle. Secondly it does look a double three structure with a triangle connector ((B)) wave. Thirdly as of right now the momentum indicators suggest it is going back above the March 2018 highs. This could possibly happen before it pulls back to correct the cycle from the December 2018 lows. Then once a pullback begins to correct the cycle from there we will look for that low to hold for the next bullish sequence higher.
Thanks for looking. Feel free to come visit our website and check out our services Free for 14 days to see if we can be of help.
Kind regards & good luck trading.
Lewis Jones of the ElliottWave-Forecast.com Team
Back

